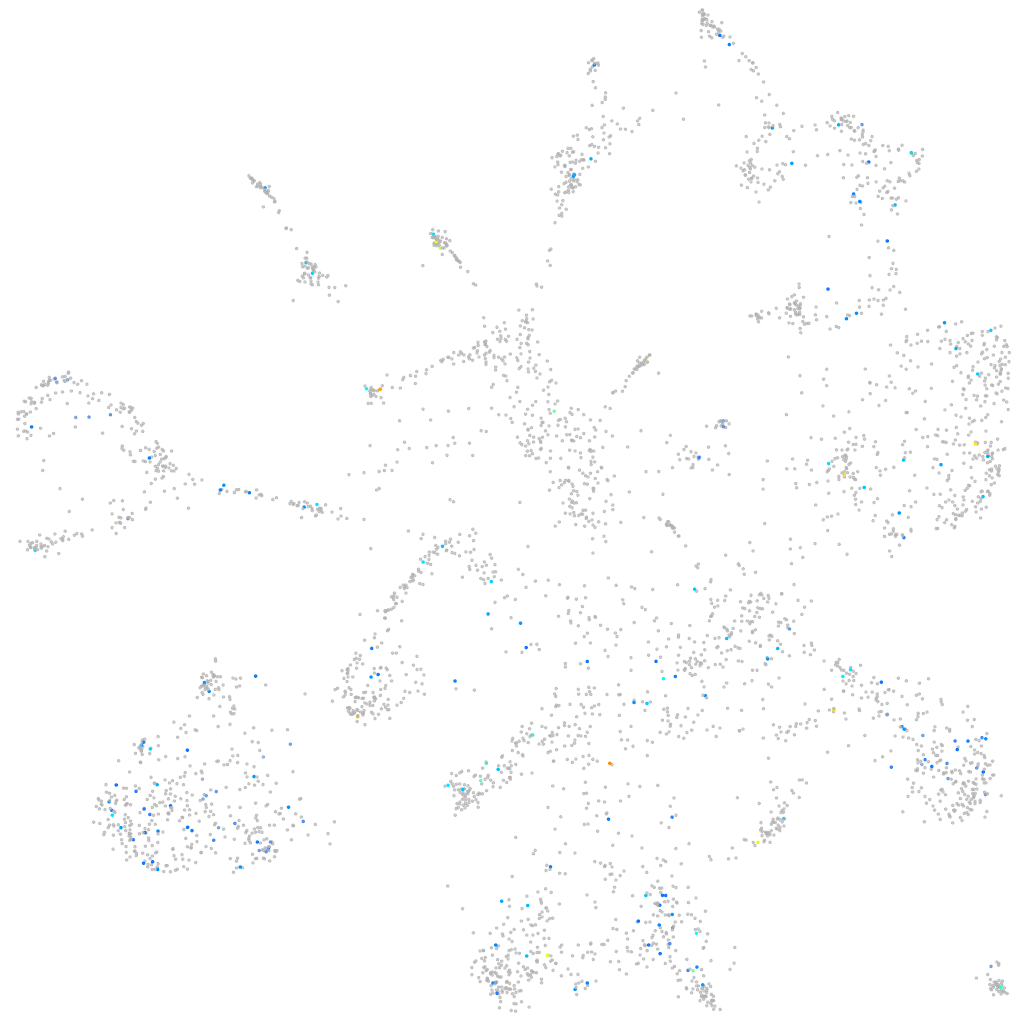
Daniocell
vti1a (mural cells / non-skeletal muscle)
vesicle transport through interaction with t-SNAREs 1A
ZFIN
Gene expression UMAP
Display:
Expression
Stage
Other cell groups
all cells
blastomeres
PGCs
endoderm
axial mesoderm
muscle
mural cells /
non-skeletal muscle
mesenchyme
hematopoietic /
vasculature
pronephros
neural
spinal cord / glia
eye
taste / olfactory
otic / lateral line
epidermis
periderm
fin
ionocytes / mucous
pigment cells
Expression by stage/cluster
Correlated gene expression
Positive correlation
Negative correlation
Gene
r
Gene
r
LOC110438122
0.162
prss59.2
-0.050
smu1b
0.154
ehd2b
-0.043
CU463038.2
0.146
pno1
-0.040
BX005419.1
0.144
tmem204
-0.040
LOC101886839
0.143
prpf18
-0.040
BX547992.1
0.138
nfkbiaa
-0.040
zgc:193807
0.119
ier2b
-0.038
galnt13
0.117
hbae1.1
-0.037
si:ch211-142b24.8
0.116
mob3c
-0.036
zgc:66484
0.114
bin1b
-0.035
LOC110440053
0.113
dgcr6
-0.035
cryba1a
0.112
mrpl37
-0.035
FP016239.1
0.112
mapk6
-0.035
asb4
0.107
ccdc85b
-0.035
CABZ01042594.1
0.107
rpz4
-0.035
skap1
0.106
fastkd2
-0.035
otol1a
0.105
fam129bb
-0.034
zic2b
0.103
anxa1a
-0.034
LOC108182290
0.103
ctrl
-0.034
CABZ01040998.1
0.102
chchd4a
-0.034
LOC100332698
0.102
slc40a1
-0.034
XLOC-005865
0.101
CR293507.1
-0.033
aldh3a1
0.101
usf1l
-0.033
LOC103909000
0.100
CELA1 (1 of many)
-0.033
XLOC-013106
0.100
LO017872.1
-0.033
CABZ01066312.1
0.100
prss35
-0.033
taar18d
0.100
si:dkey-57k2.6
-0.033
LOC101882213
0.100
apoa1b
-0.033
csrp3
0.099
vclb
-0.033
ttc41
0.096
slc44a2
-0.033
pdp1
0.096
galt
-0.033
CR388207.1
0.095
mycb
-0.033
BX649266.2
0.095
GNB4
-0.033
zar1
0.095
hibadha
-0.033
igsf5a
0.095
hbbe2
-0.033