Daniocell
vti1a (fin)
vesicle transport through interaction with t-SNAREs 1A
ZFIN
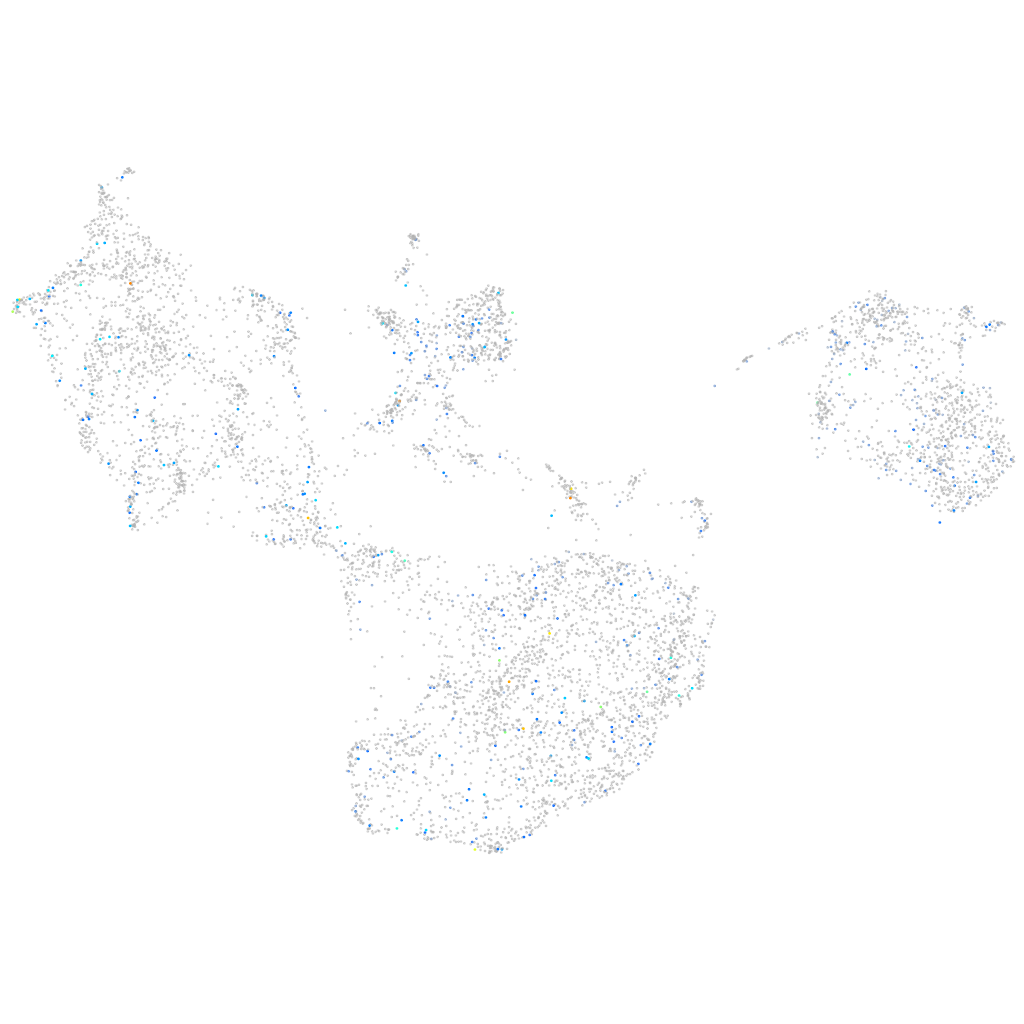
Gene expression UMAP
Display:
Expression
Stage
Other cell groups
all cells
blastomeres
PGCs
endoderm
axial mesoderm
muscle
mural cells /
non-skeletal muscle
mesenchyme
hematopoietic /
vasculature
pronephros
neural
spinal cord / glia
eye
taste / olfactory
otic / lateral line
epidermis
periderm
fin
ionocytes / mucous
pigment cells
Expression by stage/cluster
Correlated gene expression
Positive correlation
Negative correlation
Gene
r
Gene
r
LOC103911035
0.169
rps15a
-0.055
XLOC-009121
0.167
rpl39
-0.053
si:ch211-281g13.4
0.160
rps7
-0.053
znf1108
0.150
rplp1
-0.048
BX546503.1
0.129
rps20
-0.046
LOC110438678
0.126
rps13
-0.045
c3b.2
0.122
rps23
-0.043
LOC103909650
0.120
rplp2l
-0.042
CR848759.1
0.120
rpl8
-0.040
CABZ01079872.1
0.115
rpl7a
-0.040
FQ312017.1
0.115
si:dkey-151g10.6
-0.040
si:ch211-238e22.7
0.113
rpl36a
-0.038
adgre5b.2
0.113
rpl31
-0.038
CT737162.3
0.112
ppifb
-0.038
FP015860.1
0.111
aqp3a
-0.037
LOC795227
0.109
dap1b
-0.037
fam136a
0.108
rps25
-0.037
slc6a2
0.108
rps2
-0.036
csf3r
0.105
rpl35a
-0.036
samhd1
0.105
rpl22
-0.036
LOC108179300
0.100
rps26l
-0.035
XLOC-032793
0.100
mylipb
-0.034
kcnip3a
0.100
rpl15
-0.034
znf365
0.098
lamb4
-0.033
pclaf
0.097
itgb1b.2
-0.033
tmeff1a
0.096
rps3a
-0.033
LOC108179687
0.095
rpl27
-0.033
AL929229.1
0.093
rpl24
-0.033
LOC110437922
0.092
eef1da
-0.032
si:ch73-27e22.3
0.092
rpl17
-0.032
zgc:194336
0.092
rps9
-0.032
LOC108181627
0.092
MCMDC2
-0.032
XLOC-022611
0.090
rpl19
-0.032
slc41a2a
0.090
auh
-0.031
mir301c
0.090
micu2
-0.031