Daniocell
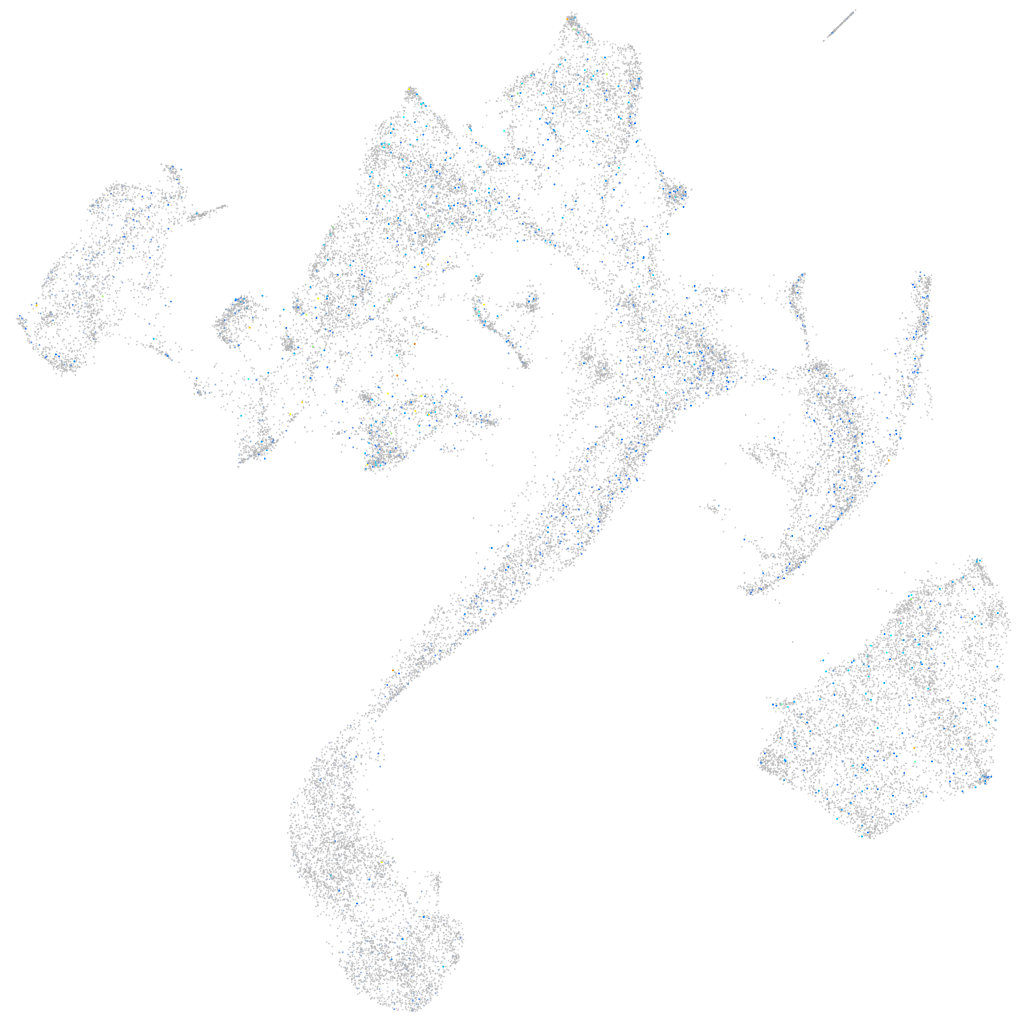
vti1a (muscle)
vesicle transport through interaction with t-SNAREs 1A
ZFIN
Gene expression UMAP
Display:
Expression
Stage
Other cell groups
all cells
blastomeres
PGCs
endoderm
axial mesoderm
muscle
mural cells /
non-skeletal muscle
mesenchyme
hematopoietic /
vasculature
pronephros
neural
spinal cord / glia
eye
taste / olfactory
otic / lateral line
epidermis
periderm
fin
ionocytes / mucous
pigment cells
Expression by stage/cluster
Correlated gene expression
Positive correlation
Negative correlation
Gene
r
Gene
r
prr15lb
0.072
myoz1b
-0.040
LOC103911924
0.068
tnni2a.4
-0.039
lipia
0.066
actn3a
-0.039
hmgcll1
0.064
mylpfb
-0.038
CABZ01068842.1
0.062
mylz3
-0.038
si:ch211-239d6.2
0.061
acta1b
-0.037
v2rh7
0.059
casq1a
-0.036
si:dkeyp-7a3.1
0.059
tpma
-0.036
fbxo41
0.059
ckmb
-0.035
LOC103909948
0.059
tnnt3a
-0.035
LOC101884052
0.058
ckma
-0.035
si:dkeyp-86f7.4
0.058
si:ch211-255p10.3
-0.035
LOC110439553
0.058
si:ch73-367p23.2
-0.035
srd5a2b
0.058
XLOC-025819
-0.035
LOC101886601.1
0.057
tnnt3b
-0.035
si:cabz01007794.1
0.056
slc25a4
-0.035
znf1172
0.056
myhz1.3
-0.034
si:ch73-223p23.2
0.055
tmod4
-0.034
cplx2
0.055
hhatla
-0.034
si:ch73-30b17.2
0.054
smyd1a
-0.034
zmp:0000001073
0.054
casq1b
-0.034
bfb
0.054
XLOC-005350
-0.034
CR383676.1
0.053
ak1
-0.033
es1
0.052
ldb3b
-0.033
calhm1
0.051
pvalb2
-0.033
dgat1a
0.051
myhz1.1
-0.033
hs3st1l1
0.051
igfn1.1
-0.033
ccdc181
0.050
CABZ01061524.1
-0.033
si:dkeyp-72a4.1
0.050
myl1
-0.033
LOC103910383
0.050
myom2a
-0.033
XLOC-038703
0.049
atp2a1
-0.032
iqsec2a
0.049
prr33
-0.032
LOC101882015
0.048
XLOC-006515
-0.032
BX649231.1
0.048
pvalb1
-0.032
XLOC-025509
0.047
mylpfa
-0.032