Daniocell
vti1a (epidermis)
vesicle transport through interaction with t-SNAREs 1A
ZFIN
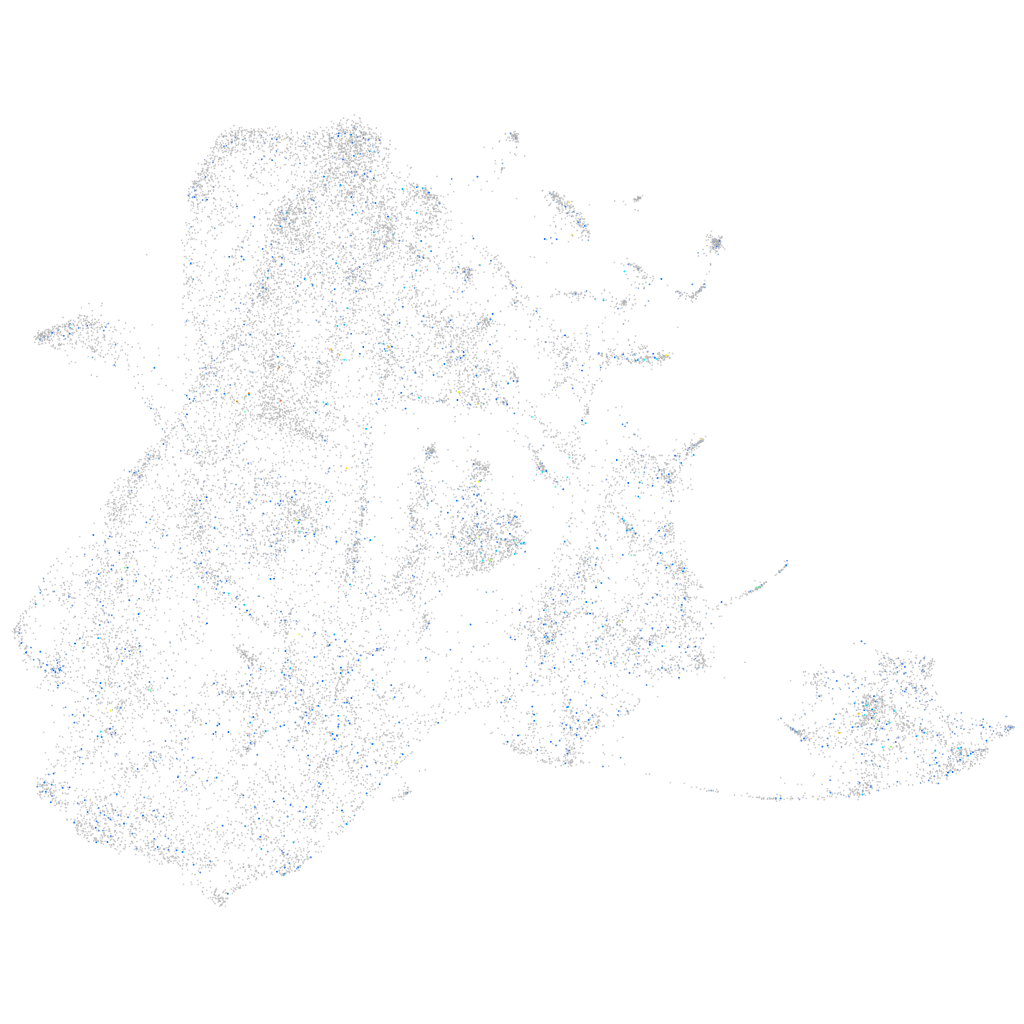
Gene expression UMAP
Display:
Expression
Stage
Other cell groups
all cells
blastomeres
PGCs
endoderm
axial mesoderm
muscle
mural cells /
non-skeletal muscle
mesenchyme
hematopoietic /
vasculature
pronephros
neural
spinal cord / glia
eye
taste / olfactory
otic / lateral line
epidermis
periderm
fin
ionocytes / mucous
pigment cells
Expression by stage/cluster
Correlated gene expression
Positive correlation
Negative correlation
Gene
r
Gene
r
XLOC-034522
0.113
tmsb4x
-0.050
LOC110439578
0.080
krt5
-0.047
CABZ01072254.1
0.078
pfn1
-0.047
XLOC-039791
0.074
krt91
-0.047
si:ch211-45c16.2
0.074
zgc:136930
-0.045
ftr30
0.072
krtt1c19e
-0.045
CABZ01084564.1
0.069
rbp4
-0.045
LOC103910264
0.067
si:dkey-183i3.5
-0.043
kcnj12b
0.067
ecrg4b
-0.043
LOC108190601
0.067
aep1
-0.042
radil
0.066
zgc:175088
-0.042
CR792417.1
0.065
lgals1l1
-0.042
arfgap3
0.064
cyt1l
-0.041
fam228a
0.064
ptgdsb.1
-0.041
CU468723.2
0.064
si:dkey-16p21.8
-0.041
CT027674.1
0.063
cldn1
-0.040
mt-nd2
0.063
actb2
-0.039
or137-2
0.062
si:dkey-33c14.3
-0.039
mt-atp6
0.062
spaca4l
-0.039
mt-nd1
0.062
col1a1b
-0.039
LOC103910804
0.061
col1a2
-0.038
gbgt1l4
0.059
cyt1
-0.038
XLOC-032764
0.059
pxna
-0.037
mt-co2
0.058
postnb
-0.036
PEBP4
0.058
cxl34b.11
-0.036
tprg1
0.057
rpl35
-0.036
pcdh2g2
0.057
cotl1
-0.036
XLOC-041220
0.057
sparc
-0.035
ncf4
0.057
col11a1a
-0.035
LOC101882499
0.056
krt4
-0.035
gbgt1l3
0.056
cckb
-0.034
mt-cyb
0.056
wu:fa03e10
-0.034
ankrd11
0.056
itgb1b.2
-0.034
CU861453.1
0.055
cdo1
-0.033
pla2g4f.1
0.054
pabpc1b
-0.033