Daniocell
vti1a (ionocytes / mucous-producing)
vesicle transport through interaction with t-SNAREs 1A
ZFIN
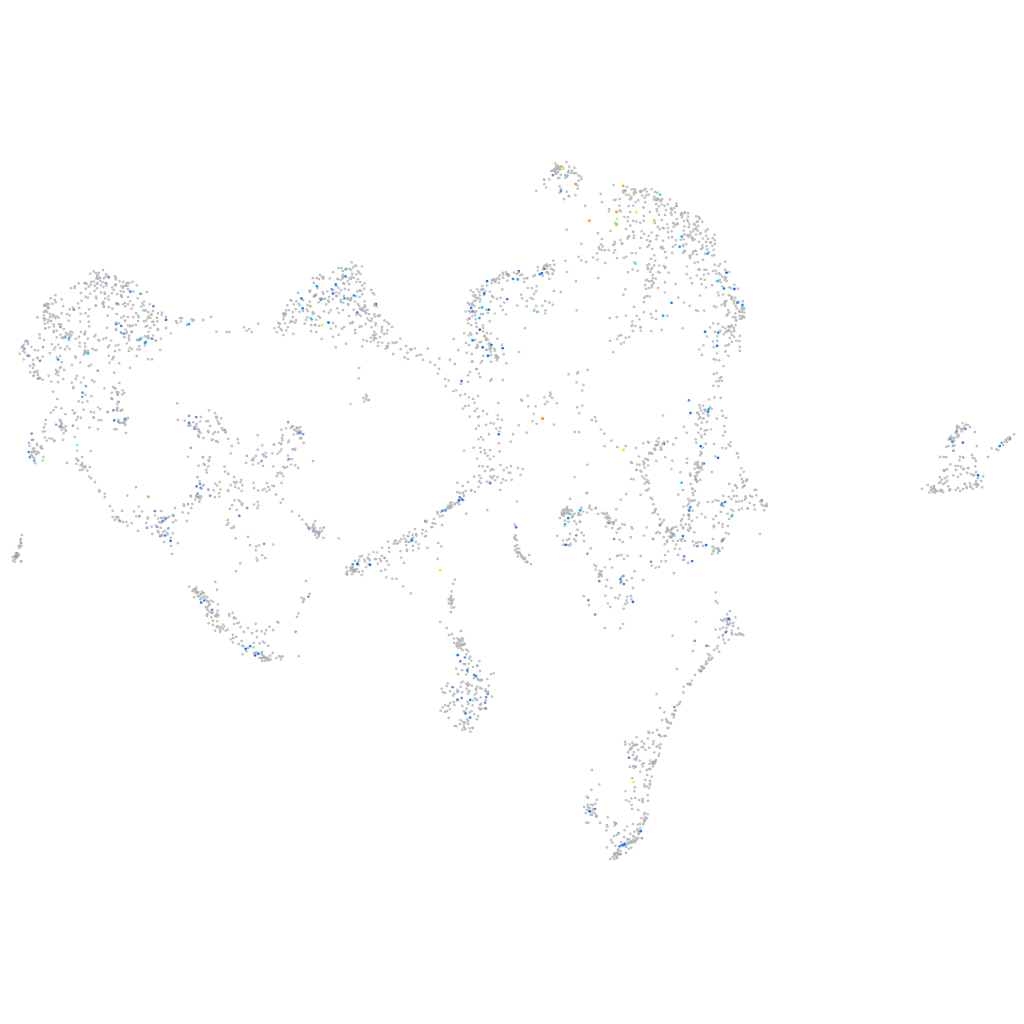
Gene expression UMAP
Display:
Expression
Stage
Other cell groups
all cells
blastomeres
PGCs
endoderm
axial mesoderm
muscle
mural cells /
non-skeletal muscle
mesenchyme
hematopoietic /
vasculature
pronephros
neural
spinal cord / glia
eye
taste / olfactory
otic / lateral line
epidermis
periderm
fin
ionocytes / mucous
pigment cells
Expression by stage/cluster
Correlated gene expression
Positive correlation
Negative correlation
Gene
r
Gene
r
CU681836.2
0.188
rps2
-0.072
gltpd2
0.187
ran
-0.062
gpr141
0.185
rpl18
-0.062
si:dkey-14d8.6
0.185
rps26
-0.061
LOC110439813
0.183
rpl10
-0.061
FP016142.1
0.179
rpl39
-0.060
LOC103910453
0.176
eif3ea
-0.059
slc2a15b
0.176
si:dkey-42i9.4
-0.059
scmh1
0.169
eif5a
-0.058
BX296526.2
0.161
rps23
-0.056
usp28
0.160
faua
-0.056
camk1gb
0.158
rpl35
-0.055
rapgef4
0.155
rps15
-0.055
XLOC-030902
0.154
polr2k
-0.051
LOC108191933
0.152
paip2b
-0.050
hamp
0.150
ube2e3
-0.049
si:ch211-239f4.1
0.148
gsta.1
-0.049
si:ch211-256e16.4
0.146
rpl18a
-0.049
BX005005.1
0.144
sp3b
-0.048
zbtb24
0.142
rpl22l1
-0.048
si:dkey-27p18.5
0.142
stau2
-0.047
si:ch1073-153i20.2
0.141
emd
-0.047
CABZ01109480.1
0.141
rps4x
-0.047
si:dkey-79f11.5
0.141
nop53
-0.046
mhc1zda
0.139
ahcy
-0.046
si:ch211-283g2.3
0.138
si:ch211-14a17.11
-0.046
mylk4a
0.138
lrrc20
-0.046
XLOC-037648
0.136
hint1
-0.046
ftr91
0.136
hmgb1a
-0.045
nfatc1
0.135
her15.1
-0.045
asb2a.1
0.133
rps21
-0.045
XLOC-011956
0.133
ywhae1
-0.044
XLOC-032121
0.131
bysl
-0.044
LO017799.1
0.131
rps19bp1
-0.044
asb10
0.130
eif3k
-0.044