Daniocell
si:ch73-27e22.8 (epidermis)
si:ch73-27e22.8
ZFIN
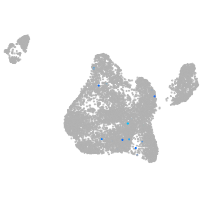
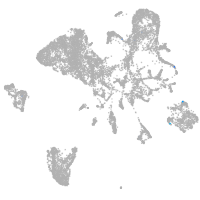
Gene expression UMAP
Display:
Expression
Stage
Other cell groups
all cells
blastomeres
PGCs
endoderm
axial mesoderm
muscle
mural cells /
non-skeletal muscle
mesenchyme
hematopoietic /
vasculature
pronephros
neural
spinal cord / glia
eye
taste / olfactory
otic / lateral line
epidermis
periderm
fin
ionocytes / mucous
pigment cells
Expression by stage/cluster
Correlated gene expression
Positive correlation
Negative correlation
Gene
r
Gene
r
LOC110438013
0.287
rps15a
-0.021
vegfbb
0.211
arl4cb
-0.016
si:ch211-117n7.6
0.163
atp5pb
-0.016
BX004803.1
0.156
psmb4
-0.015
LOC101886071
0.137
lamtor4
-0.015
LOC108181393
0.136
pomp
-0.015
LOC101885708
0.133
zc3h11a
-0.014
BX908782.1
0.127
ube2d2
-0.014
XLOC-004843
0.110
ciapin1
-0.014
CCKBR
0.106
ndufa2
-0.014
LOC101883185
0.098
pum3
-0.014
wwox
0.097
zgc:56676
-0.013
XLOC-013609
0.090
echs1
-0.013
XLOC-036690
0.090
vdrb
-0.013
CR385050.2
0.085
gpkow
-0.013
si:ch211-131k2.3
0.083
ubc
-0.013
htr2b
0.083
srfbp1
-0.013
CLEC3A
0.082
cybc1
-0.013
XLOC-017895
0.080
hmg20b
-0.013
CR762407.3
0.077
si:dkey-102m7.3
-0.013
mb21d2
0.076
rpl27a
-0.013
LOC103911277
0.076
suds3
-0.013
ttc23
0.075
eif4e3
-0.013
kif28
0.070
csnk1a1
-0.013
LOC101884753
0.069
yars
-0.013
CABZ01030017.1
0.068
cox4i1
-0.013
XLOC-005442
0.065
atp1b3a
-0.013
FO834831.1
0.065
rpl10a
-0.013
XLOC-020031
0.064
eif6
-0.012
XLOC-013628
0.063
psat1
-0.012
LOC110440211
0.062
sin3b
-0.012
BX005396.4
0.062
tfb2m
-0.012
tbccd1
0.062
gnl3
-0.012
BX323560.1
0.062
cxcr4a
-0.012
si:ch211-240l19.6
0.062
kdm1a
-0.012