Daniocell
si:ch73-27e22.8 (mesenchyme)
si:ch73-27e22.8
ZFIN
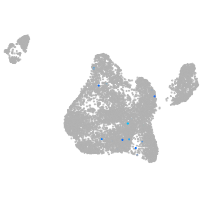
Gene expression UMAP
Display:
Expression
Stage
Other cell groups
all cells
blastomeres
PGCs
endoderm
axial mesoderm
muscle
mural cells /
non-skeletal muscle
mesenchyme
hematopoietic /
vasculature
pronephros
neural
spinal cord / glia
eye
taste / olfactory
otic / lateral line
epidermis
periderm
fin
ionocytes / mucous
pigment cells
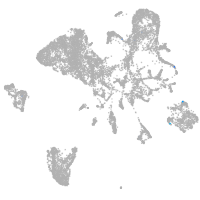
Expression by stage/cluster
Correlated gene expression
Positive correlation
Negative correlation
Gene
r
Gene
r
LOC103909274
0.102
fabp3
-0.017
CR925723.3
0.092
h2afvb
-0.016
LOC101885096
0.090
nedd8
-0.016
LOC110438548
0.079
si:dkey-151g10.6
-0.016
BX321882.1
0.076
pabpc1a
-0.015
LOC103911956
0.076
npm1a
-0.015
XLOC-015260
0.075
snrpf
-0.015
LOC101883368
0.071
dlx5a
-0.014
mc1r
0.067
rbbp4
-0.014
LOC101885457
0.063
psmd4a
-0.014
LOC110438294
0.063
ddx39ab
-0.014
si:ch73-252i11.1
0.061
mak16
-0.014
zfyve9b
0.061
ccdc58
-0.013
CR339059.3
0.058
bcl7a
-0.013
cfhl1
0.057
dars
-0.013
LOC108191752
0.056
setb
-0.013
CABZ01056629.1
0.055
atp5pd
-0.013
CABZ01049362.1
0.055
snrpg
-0.013
CR790368.1
0.055
uba2
-0.013
znf1135
0.054
snrpb2
-0.013
olfcs1
0.052
psma5
-0.013
LOC101884506
0.052
sf3a2
-0.013
CU914602.1
0.051
med11
-0.013
XLOC-001601
0.051
fam133b
-0.013
LOC103909971.1
0.050
NDUFB1
-0.013
kcnk13a
0.050
prmt1
-0.013
BX927282.3
0.049
cox6b2
-0.013
TMEM216
0.049
hmga1a
-0.013
BX548046.2
0.048
cox6c
-0.013
cldn10a
0.048
ppa1b
-0.013
gmpr2
0.048
rpl7a
-0.013
drd4b
0.047
prdx3
-0.013
si:ch211-213d14.2
0.047
psmb7
-0.013
fam183a
0.047
h2afx
-0.013
LOC101882122
0.047
cox7b
-0.013