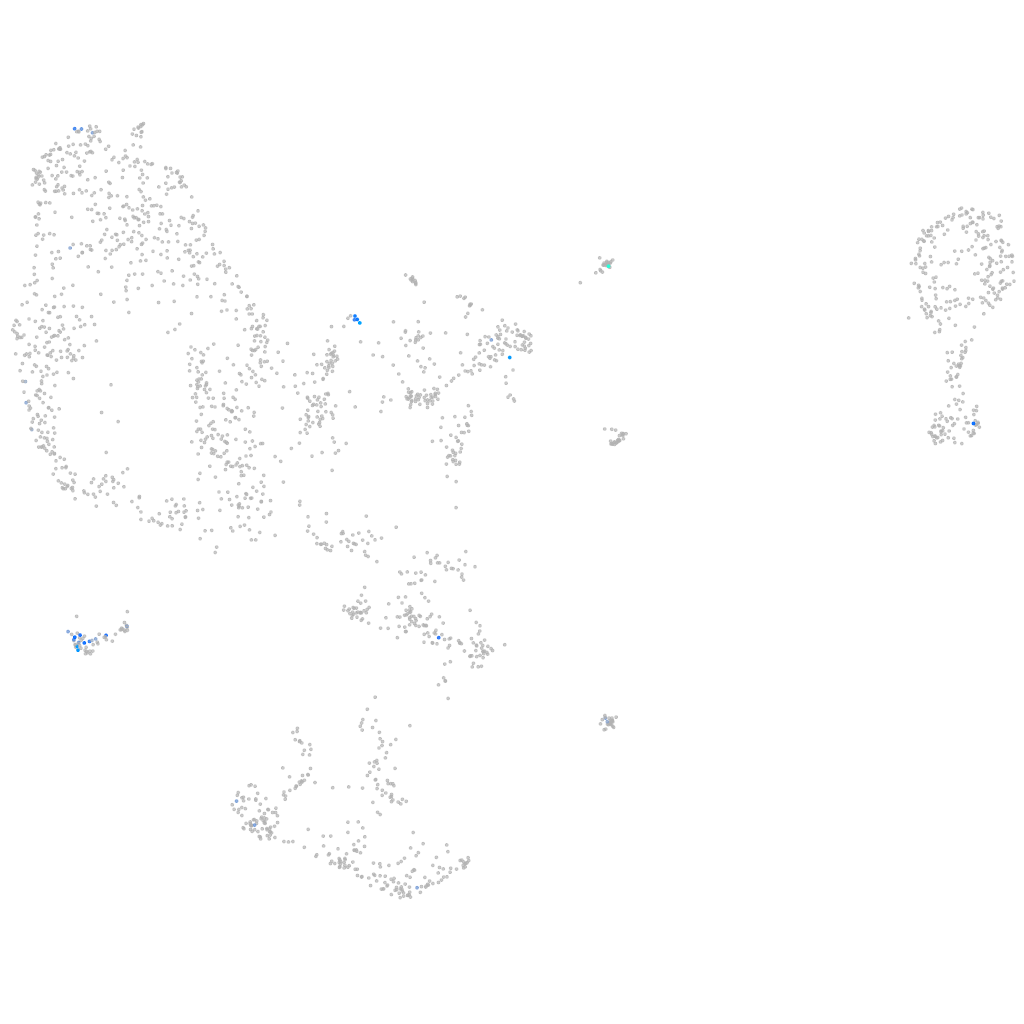
Daniocell
si:ch211-106k21.5 (pronephros)
si:ch211-106k21.5
ZFIN
Gene expression UMAP
Display:
Expression
Stage
Other cell groups
all cells
blastomeres
PGCs
endoderm
axial mesoderm
muscle
mural cells /
non-skeletal muscle
mesenchyme
hematopoietic /
vasculature
pronephros
neural
spinal cord / glia
eye
taste / olfactory
otic / lateral line
epidermis
periderm
fin
ionocytes / mucous
pigment cells
Expression by stage/cluster
Correlated gene expression
Positive correlation
Negative correlation
Gene
r
Gene
r
zfyve9b
0.437
hspe1
-0.059
prph2b
0.432
cycsb
-0.059
LOC101886880
0.385
NC-002333.4
-0.054
si:dkey-13m1.5
0.370
c1qbp
-0.053
si:ch211-14k19.8
0.361
prmt1
-0.052
ptger1b
0.355
si:dkey-56m19.5
-0.051
ptprb
0.354
rgs4
-0.051
GABRR1 (1 of many)
0.349
hnf1bb
-0.049
arhgef9b
0.341
igf2bp3
-0.048
hspa12b
0.338
dio3b
-0.048
pecam1
0.337
si:ch211-195e19.1
-0.048
si:dkeyp-97a10.2
0.336
ilf3b
-0.045
si:dkey-202e17.1
0.333
aldoaa
-0.045
agtr1b
0.332
cx43.4
-0.045
gga3b
0.328
slc4a4a
-0.045
tekt2
0.325
rpl7l1
-0.044
kank3
0.321
canx
-0.044
plvapa
0.316
lin28a
-0.043
si:ch211-62a1.3
0.314
rpl22l1
-0.043
odf3b
0.313
ptmab
-0.043
calcrlb
0.308
sub1a
-0.043
BX323444.2
0.305
timm9
-0.043
limch1b
0.298
slc4a2a
-0.043
si:ch211-33e4.2
0.298
ppp1r3b
-0.043
ushbp1
0.295
apmap
-0.042
unc13d
0.292
tomm70a
-0.042
c1qtnf1
0.291
fxyd6l
-0.041
kdrl
0.290
tomm22
-0.041
myct1a
0.290
cox6b1
-0.041
LOC108179520
0.289
rps18
-0.041
znf1082
0.289
uqcrh
-0.040
CU463231.2
0.289
dhrs3b
-0.040
taar20c
0.289
atp1a1a.1
-0.040
CABZ01060891.1
0.289
rcor2
-0.039
CABZ01075114.1
0.289
nutf2
-0.039