Daniocell
si:ch211-106k21.5 (periderm)
si:ch211-106k21.5
ZFIN
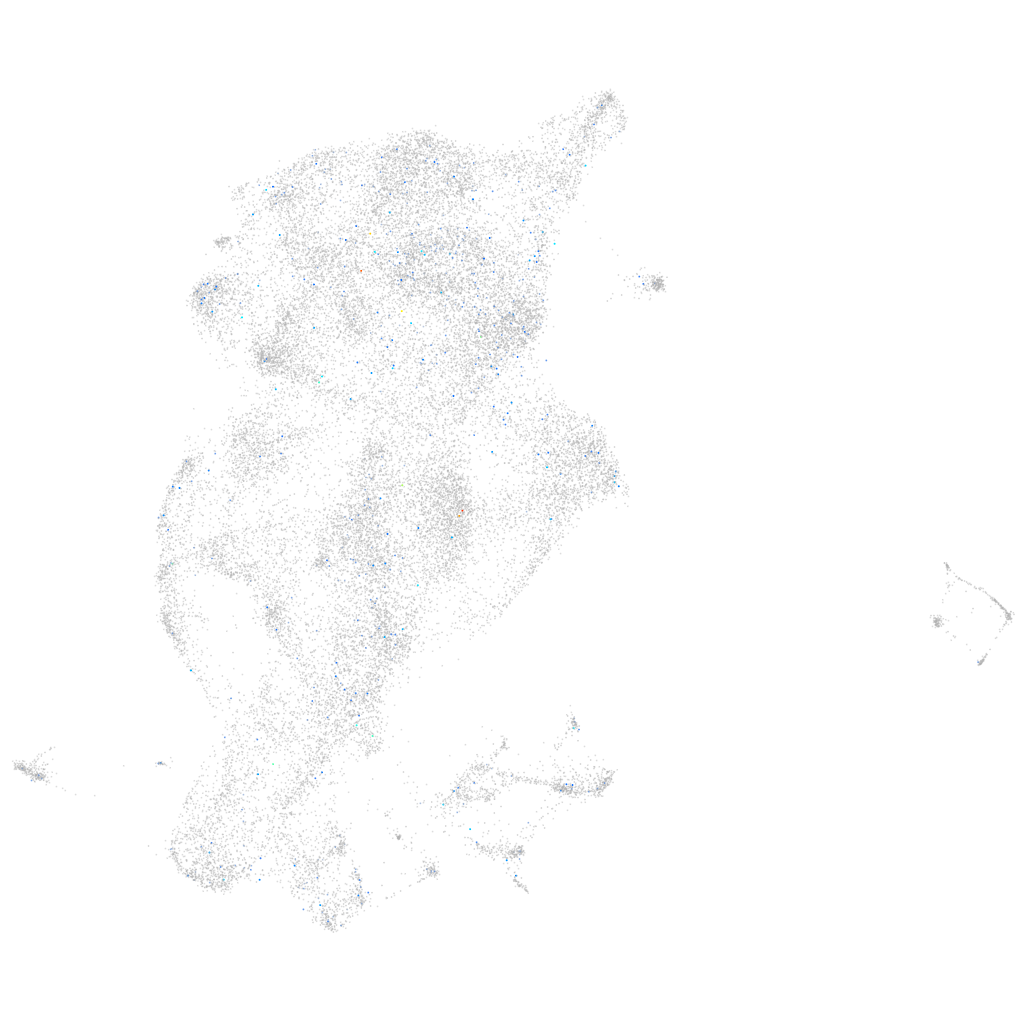
Gene expression UMAP
Display:
Expression
Stage
Other cell groups
all cells
blastomeres
PGCs
endoderm
axial mesoderm
muscle
mural cells /
non-skeletal muscle
mesenchyme
hematopoietic /
vasculature
pronephros
neural
spinal cord / glia
eye
taste / olfactory
otic / lateral line
epidermis
periderm
fin
ionocytes / mucous
pigment cells
Expression by stage/cluster
Correlated gene expression
Positive correlation
Negative correlation
Gene
r
Gene
r
efhb
0.225
tent5ba
-0.019
CT737184.2
0.215
gstp1
-0.018
si:ch211-15j1.1
0.161
cox6b1
-0.017
XLOC-029527
0.136
rpl29
-0.017
si:ch211-173n18.3
0.126
xrn2
-0.016
CABZ01085594.1
0.112
mvp
-0.016
si:ch211-232m10.6
0.107
ap3d1
-0.016
XLOC-043372
0.100
cstf1
-0.016
slc6a6a
0.088
icn
-0.016
ceacam1
0.085
bckdha
-0.016
ttc6
0.085
rps12
-0.016
scpp8
0.079
si:dkey-56i24.1
-0.015
LOC100534786
0.072
tatdn1
-0.014
map9
0.071
mnta
-0.014
alkal1
0.070
tars
-0.014
LOC101885099
0.068
bet1
-0.014
zgc:136908
0.065
aep1
-0.013
LOC110440151
0.065
cbx3b
-0.013
myl4
0.064
rps29
-0.013
fstl5
0.062
anxa1c
-0.013
LOC101882112
0.061
si:dkey-9l20.3
-0.013
LOC101884287
0.061
suds3
-0.013
XLOC-014886
0.060
hnrnpl
-0.013
slc12a1
0.059
pdcd5
-0.013
si:ch211-220i18.4
0.059
ptprda
-0.013
LOC110438076
0.059
wu:fb18f06
-0.013
podxl
0.058
rpl27
-0.013
CABZ01066312.1
0.057
dennd3a
-0.013
cfap45
0.057
chd4b
-0.013
CR536604.1
0.057
myhz1.2
-0.013
si:dkey-105h12.2
0.056
si:ch211-166g5.4
-0.013
sp100.2
0.056
cxcr4b
-0.013
XLOC-044320
0.055
rps26l
-0.013
LOC101882039
0.055
rn7sk
-0.012
si:dkey-11k2.7
0.055
tcf7l1a
-0.012