Daniocell
si:ch211-106k21.5 (fin)
si:ch211-106k21.5
ZFIN
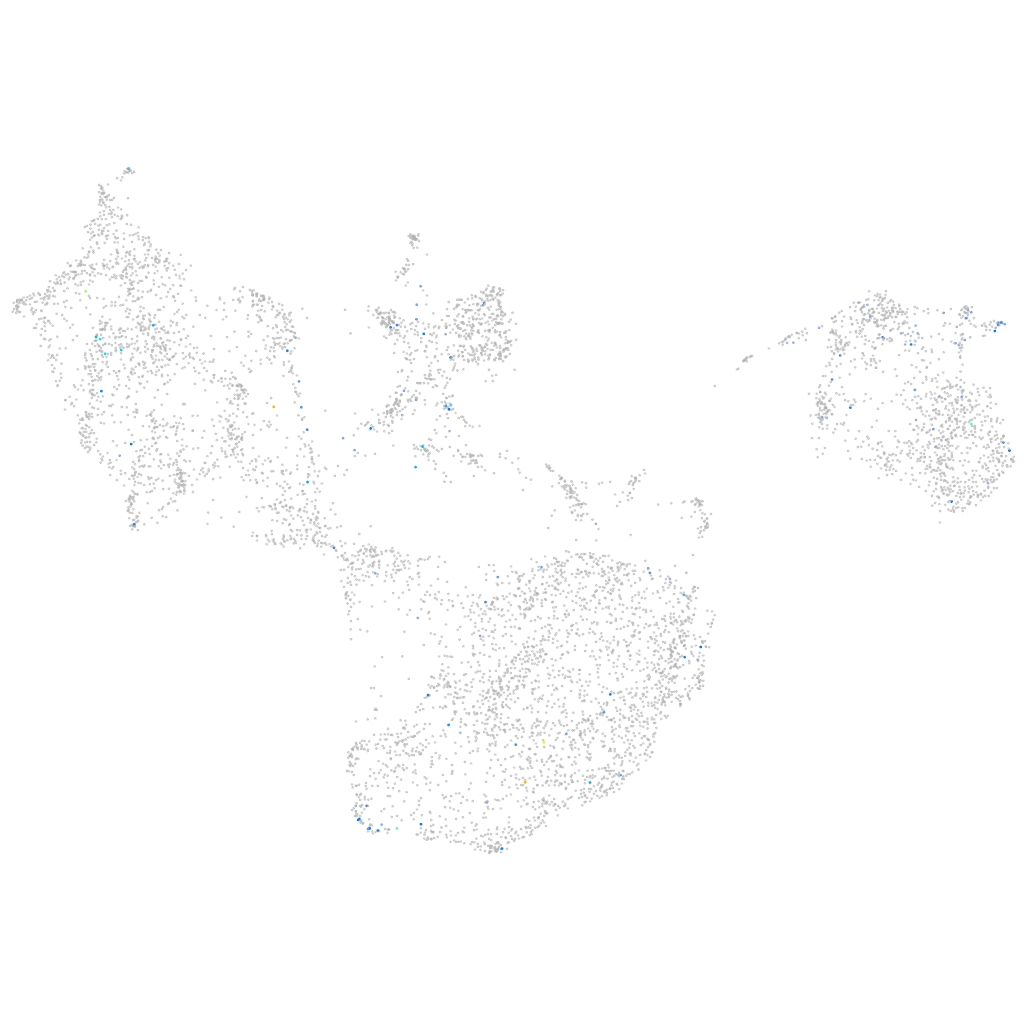
Gene expression UMAP
Display:
Expression
Stage
Other cell groups
all cells
blastomeres
PGCs
endoderm
axial mesoderm
muscle
mural cells /
non-skeletal muscle
mesenchyme
hematopoietic /
vasculature
pronephros
neural
spinal cord / glia
eye
taste / olfactory
otic / lateral line
epidermis
periderm
fin
ionocytes / mucous
pigment cells
Expression by stage/cluster
Correlated gene expression
Positive correlation
Negative correlation
Gene
r
Gene
r
CU571091.1
0.251
rpl29
-0.050
XLOC-042319
0.245
col1a1a
-0.050
nanog
0.203
and1
-0.044
CABZ01065328.2
0.200
vcanb
-0.042
cldn15lb
0.194
hpdb
-0.040
proca
0.177
zmp:0000000846
-0.038
znfl1h
0.177
emilin2b
-0.037
ompb
0.174
col12a1b
-0.037
armc3
0.170
arhgef25b
-0.037
SP5 (1 of many)
0.168
rps29
-0.036
grm5a
0.165
ucp1
-0.035
CABZ01061495.1
0.164
hoxc10a
-0.034
adamts16
0.155
rps28
-0.032
LOC100004591
0.154
klf15
-0.032
CR354540.2
0.152
cxcr4a
-0.032
tiam2b
0.149
and2
-0.032
slc24a5
0.147
CABZ01074130.1
-0.032
unm-sa911
0.147
rpl39
-0.031
XLOC-037648
0.146
zgc:66479
-0.031
scospondin
0.145
ldhba
-0.030
adra1ab
0.143
rplp2l
-0.030
XLOC-042488
0.141
cxcl14
-0.029
LOC101886884
0.139
thbs4a
-0.028
iqub
0.136
qdpra
-0.028
LOC108190667
0.135
hoxc13a
-0.028
or107-1
0.135
col17a1a
-0.028
LOC108180727
0.134
igfbp2a
-0.027
mep1a.2
0.133
itgb1b.2
-0.027
znf1111
0.132
matn4
-0.027
XLOC-024446
0.132
si:ch211-243g18.2
-0.027
LOC101885558
0.127
slc16a10
-0.027
si:dkey-83m22.7
0.123
ccdc3a
-0.026
LOC108179520
0.122
hnrnpaba
-0.026
bmp3
0.120
glud1b
-0.026
crocc2
0.120
tnc
-0.026