Daniocell
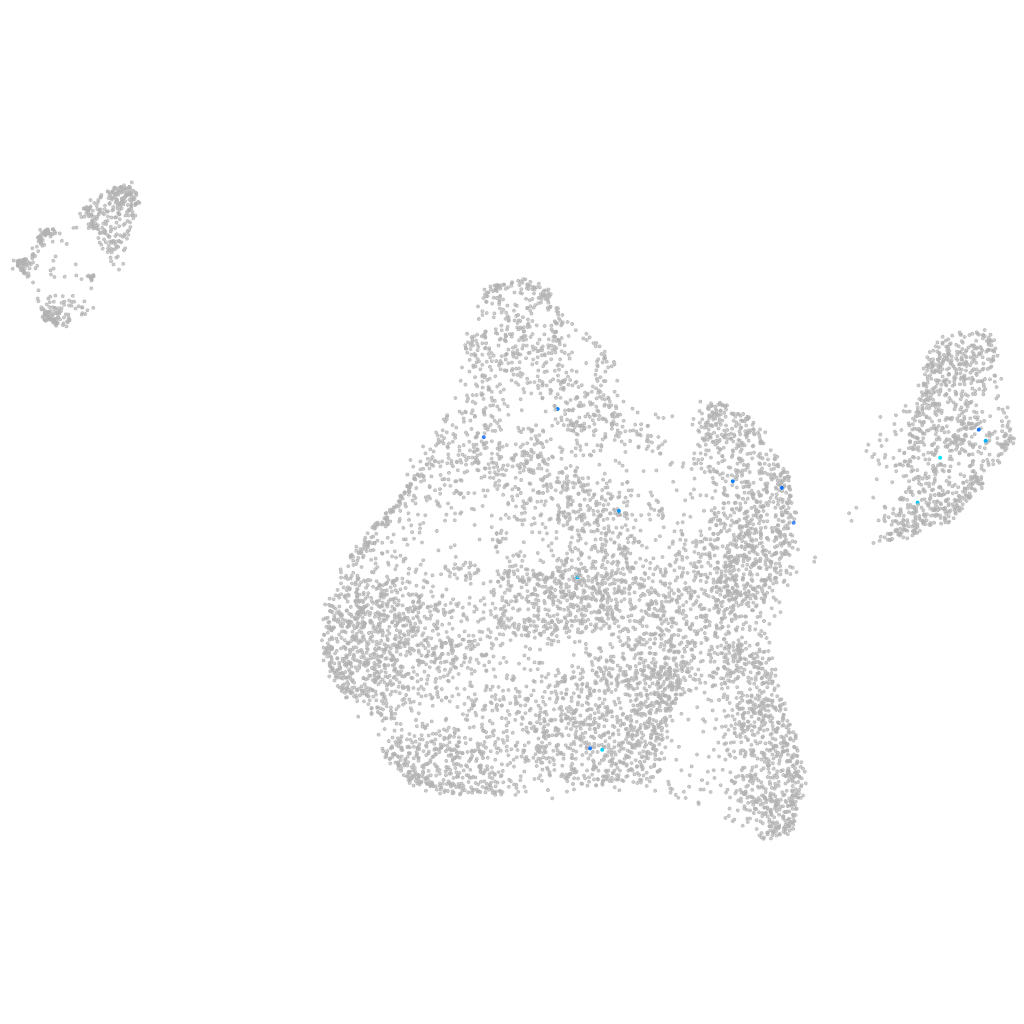
si:ch211-106k21.5 (blastomeres)
si:ch211-106k21.5
ZFIN
Gene expression UMAP
Display:
Expression
Stage
Other cell groups
all cells
blastomeres
PGCs
endoderm
axial mesoderm
muscle
mural cells /
non-skeletal muscle
mesenchyme
hematopoietic /
vasculature
pronephros
neural
spinal cord / glia
eye
taste / olfactory
otic / lateral line
epidermis
periderm
fin
ionocytes / mucous
pigment cells
Expression by stage/cluster
Correlated gene expression
Positive correlation
Negative correlation
Gene
r
Gene
r
hamp
0.382
elof1
-0.034
si:dkey-193p11.2
0.333
rpl11
-0.032
LOC100333228
0.265
zmat2
-0.031
nek12
0.239
faua
-0.030
si:dkey-23n7.10
0.231
phf5a
-0.029
LOC799914
0.207
yy1a
-0.027
LOC108192084
0.193
e2f3
-0.027
LOC110438002
0.187
utp6
-0.027
cldn15lb
0.178
arglu1a
-0.027
zgc:103681
0.178
tktb
-0.027
col9a1b
0.162
si:dkey-19e4.5
-0.026
cyp2p9
0.158
tpt1
-0.025
si:ch73-308m11.1
0.151
nnr
-0.025
fign
0.151
anapc10
-0.025
LOC100535208
0.148
ilf3b
-0.025
cxcl11.1
0.147
zc4h2
-0.025
RNF180
0.147
rps3
-0.025
si:ch211-56a11.2
0.139
eef1g
-0.025
BX322661.3
0.138
si:dkey-33c12.4
-0.025
paqr6
0.135
mrps28
-0.025
pyyb
0.131
pa2g4b
-0.025
p4htm
0.128
zcrb1
-0.025
myh7bb
0.120
ssr1
-0.024
RF00322
0.116
mt-nd3
-0.024
BX649276.1
0.115
hs6st2
-0.023
XLOC-013311
0.114
mob1bb
-0.023
zgc:171775
0.113
srp54
-0.023
zgc:77784
0.111
eif3ea
-0.023
si:ch211-212d10.2
0.109
selenow1
-0.023
sult2st3
0.109
cstf1
-0.023
si:dkey-6l15.1
0.103
cox6b2
-0.023
LOC101883268
0.099
kars
-0.022
fam198a
0.098
ddt
-0.022
cacng3b
0.098
nelfe
-0.022
CABZ01066224.1
0.098
add3a
-0.022