Daniocell
si:ch211-102c2.8 (taste / olfactory)
si:ch211-102c2.8
ZFIN
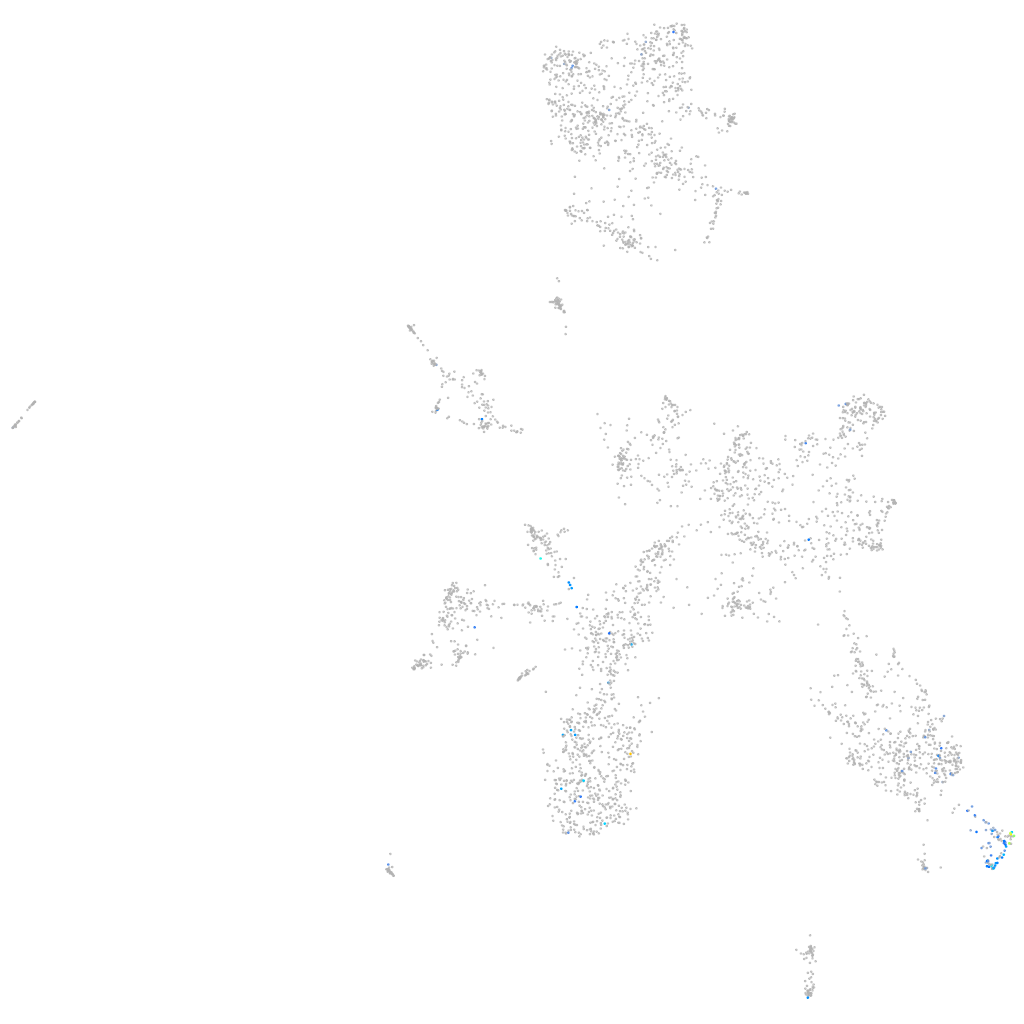
Gene expression UMAP
Display:
Expression
Stage
Other cell groups
all cells
blastomeres
PGCs
endoderm
axial mesoderm
muscle
mural cells /
non-skeletal muscle
mesenchyme
hematopoietic /
vasculature
pronephros
neural
spinal cord / glia
eye
taste / olfactory
otic / lateral line
epidermis
periderm
fin
ionocytes / mucous
pigment cells
Expression by stage/cluster
Correlated gene expression
Positive correlation
Negative correlation
Gene
r
Gene
r
si:dkey-88n24.12
0.469
ptmab
-0.109
si:dkeyp-69c1.9
0.456
marcksl1b
-0.094
odf3b
0.449
marcksl1a
-0.090
si:ch73-242m19.1
0.445
cirbpa
-0.087
gb:eh456644
0.425
fthl27
-0.083
si:ch211-163l21.7
0.414
hmgn6
-0.082
paqr5b
0.411
h3f3c
-0.081
zgc:195356
0.410
hnrnpaba
-0.080
LOC100329490
0.401
si:ch211-222l21.1
-0.079
c8h22orf15
0.400
ppiab
-0.075
dnah5l
0.397
ran
-0.075
si:ch211-250c4.5
0.394
hmgn7
-0.075
tbata
0.392
hmgn2
-0.074
dnah3
0.390
h3f3a
-0.072
crocc2
0.387
si:ch73-1a9.3
-0.070
mustn1a
0.386
hmgb1b
-0.068
si:dkey-30e9.6
0.384
zgc:92380
-0.067
dnah1
0.378
hmgb3a
-0.067
ccdc169
0.374
tox
-0.063
ccdc153
0.373
hmgb2a
-0.063
CABZ01087025.3
0.366
cirbpb
-0.062
si:dkey-188g12.1
0.364
cfl1
-0.062
CR407547.1
0.362
anp32b
-0.062
fut9d
0.360
mcm7
-0.061
zgc:158260
0.358
hnrnpa0b
-0.061
si:ch211-197n1.2
0.358
ptmaa
-0.061
tekt2
0.352
alcamb
-0.061
tsga10
0.348
ywhaz
-0.060
si:dkey-197j19.6
0.341
tubb2b
-0.060
stmnd1
0.338
eef1b2
-0.060
zgc:112416
0.335
rsl24d1
-0.059
si:dkey-11c5.11
0.335
rps26
-0.058
si:ch211-155m12.5
0.333
gng13a
-0.058
CABZ01068050.1
0.326
XLOC-003689
-0.057
hsbp1l1
0.323
ccnd1
-0.057