Daniocell
si:ch211-102c2.8 (axial mesoderm)
si:ch211-102c2.8
ZFIN
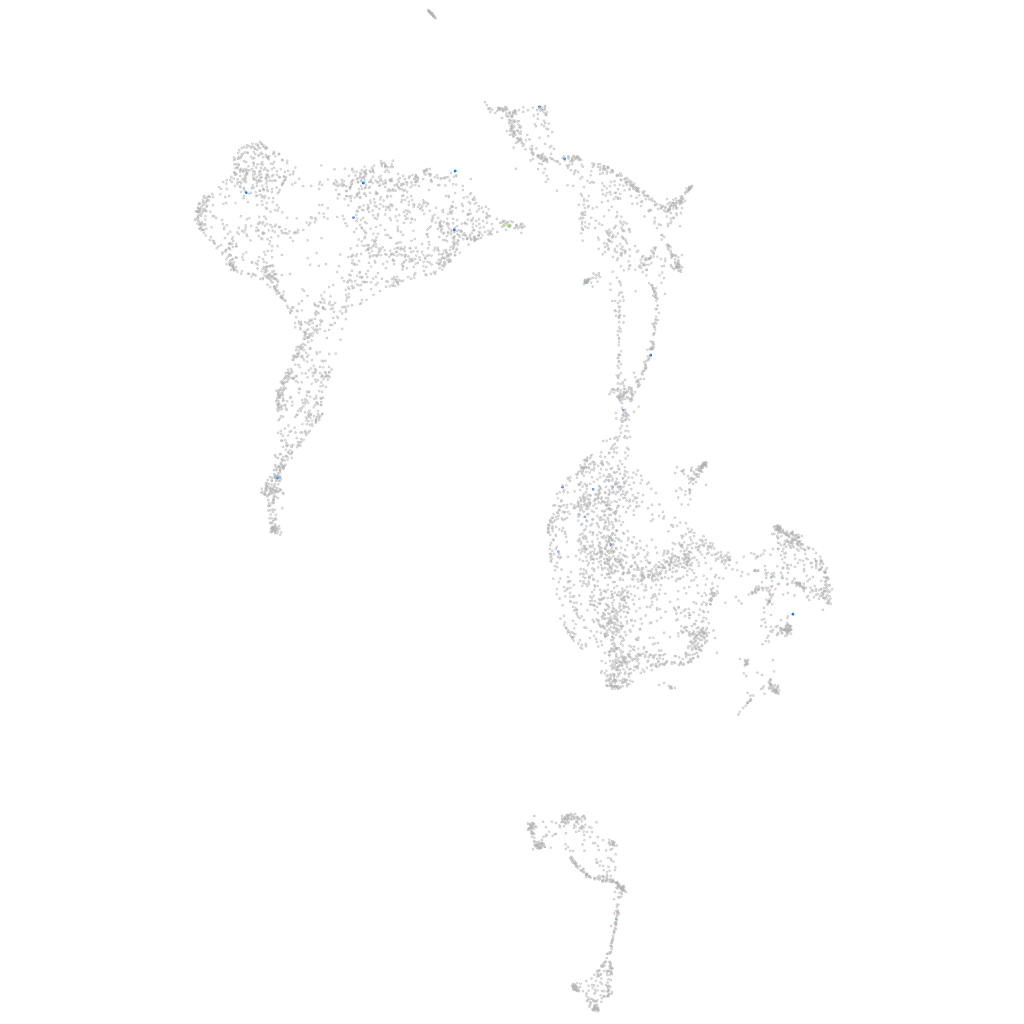
Gene expression UMAP
Display:
Expression
Stage
Other cell groups
all cells
blastomeres
PGCs
endoderm
axial mesoderm
muscle
mural cells /
non-skeletal muscle
mesenchyme
hematopoietic /
vasculature
pronephros
neural
spinal cord / glia
eye
taste / olfactory
otic / lateral line
epidermis
periderm
fin
ionocytes / mucous
pigment cells
Expression by stage/cluster
Correlated gene expression
Positive correlation
Negative correlation
Gene
r
Gene
r
mybpha
0.437
rpl23a
-0.028
si:ch211-278p9.3
0.392
rpl38
-0.027
zgc:172282
0.324
rps7
-0.024
rxfp1
0.320
si:dkey-151g10.6
-0.024
dre-let-7i
0.301
pbx4
-0.023
pign
0.254
ythdf2
-0.023
BX005443.1
0.246
cst3
-0.023
olfcg1
0.227
uba2
-0.023
XLOC-010458
0.227
ppil1
-0.023
fgf10a
0.225
eef2b
-0.022
LOC101886853
0.221
ola1
-0.022
LOC101886920
0.221
st13
-0.021
LOC103911208
0.221
tlk1b
-0.021
LOC110437769
0.214
fam32a
-0.021
si:dkey-96l17.6
0.210
matr3l1.1
-0.021
BX548075.3
0.208
eif4g2b
-0.021
si:dkey-84h14.1
0.205
uba52
-0.021
si:ch211-217k17.8
0.202
ndufb2
-0.021
LOC101886386
0.196
snrnp27
-0.021
LOC100004016
0.188
COX3
-0.020
AL953907.2
0.186
ftsj1
-0.020
XLOC-028649
0.186
ehmt1b
-0.020
txnipb
0.177
rpl24
-0.020
CT009620.1
0.173
ahsa1b
-0.020
ikzf4
0.162
mat2b
-0.020
CR933791.1
0.160
smg6
-0.020
LOC110438125
0.157
zgc:112255
-0.020
ggt1b
0.156
txn2
-0.020
LOC100536144
0.151
ripply1
-0.020
slc10a1
0.150
pcid2
-0.020
rapgef3
0.149
add1
-0.020
gck
0.145
psmd1
-0.019
CT025742.1
0.144
wu:fb97g03
-0.019
opn4.1
0.142
dcaf13
-0.019
gh1
0.138
atp1a1a.1
-0.019