Daniocell
si:ch211-102c2.8 (pigment cells)
si:ch211-102c2.8
ZFIN
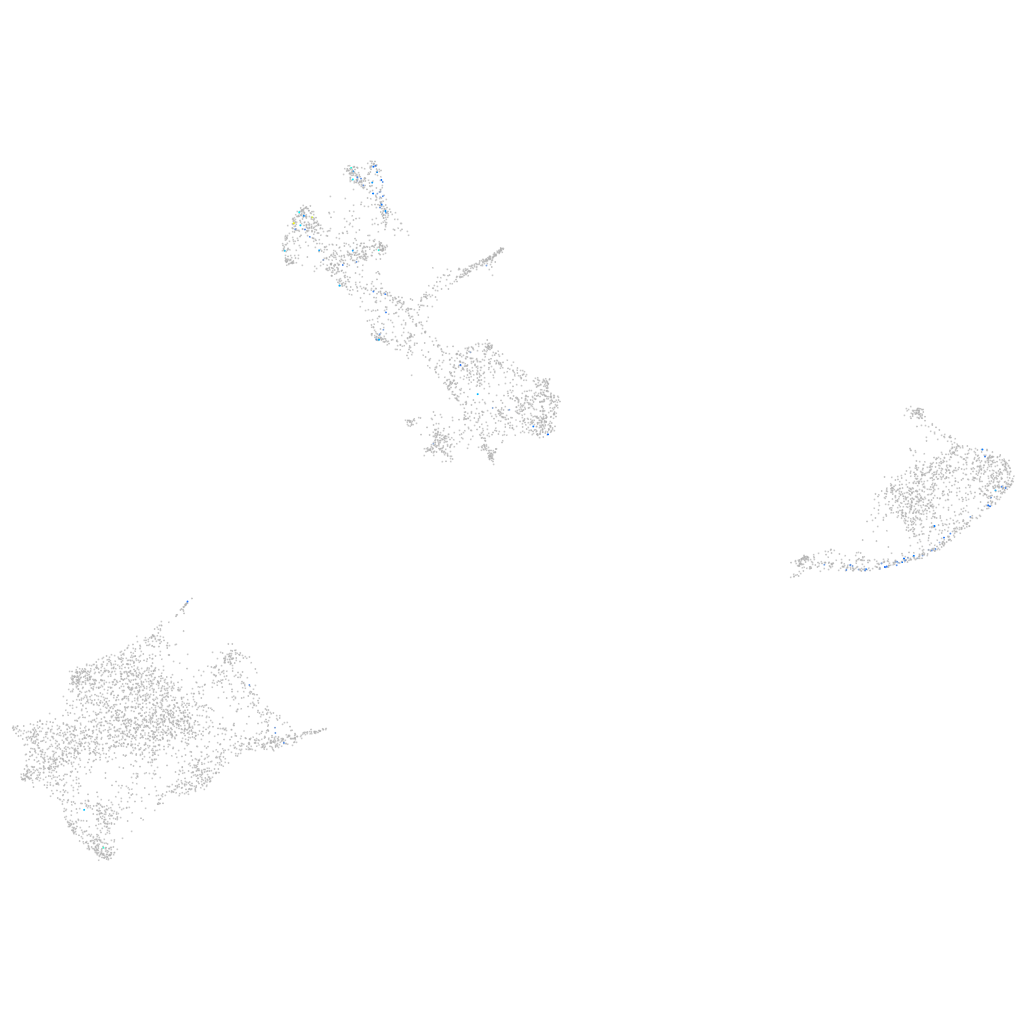
Gene expression UMAP
Display:
Expression
Stage
Other cell groups
all cells
blastomeres
PGCs
endoderm
axial mesoderm
muscle
mural cells /
non-skeletal muscle
mesenchyme
hematopoietic /
vasculature
pronephros
neural
spinal cord / glia
eye
taste / olfactory
otic / lateral line
epidermis
periderm
fin
ionocytes / mucous
pigment cells
Expression by stage/cluster
Correlated gene expression
Positive correlation
Negative correlation
Gene
r
Gene
r
si:dkeyp-79b7.3
0.244
CABZ01021592.1
-0.095
agrp
0.220
gch2
-0.086
scpp1
0.215
si:dkey-251i10.2
-0.082
CU681841.1
0.214
slc22a7a
-0.079
FAM107A (1 of many)
0.190
tmem130
-0.064
zgc:64189
0.181
marcksl1b
-0.063
XLOC-040894
0.178
pts
-0.061
BX000434.1
0.176
si:ch211-251b21.1
-0.058
XLOC-016178
0.176
aldob
-0.054
myh7
0.168
bscl2l
-0.054
LOC108179562
0.154
aox5
-0.051
XLOC-019908
0.154
si:dkey-56m19.5
-0.049
CU633823.1
0.153
slc2a11b
-0.048
fhl2a
0.150
prdx1
-0.048
syne1b
0.146
cyb5a
-0.048
akap12a
0.144
sprb
-0.047
sytl2b
0.144
aqp3a
-0.047
XLOC-005124
0.143
akr1b1
-0.045
npy
0.142
sult1st1
-0.044
LOC101886505
0.141
gpd1b
-0.044
csf1a
0.140
pax7b
-0.044
ponzr1
0.139
hbbe1.3
-0.043
tmem63bb
0.137
prdx5
-0.042
si:ch211-243a20.3
0.134
bco1
-0.042
zgc:165514
0.133
pvalb1
-0.042
emp3b
0.133
hbbe1.1
-0.042
rgs4
0.132
zgc:110339
-0.042
BX957228.1
0.131
uraha
-0.040
prx
0.130
tnni2a.4
-0.040
LOC108183612
0.129
zgc:153031
-0.040
her1
0.129
prtfdc1
-0.039
muc5d
0.129
mibp
-0.039
lypc
0.128
si:ch211-222l21.1
-0.039
crb2b
0.128
cax1
-0.039
tagln3b
0.128
oacyl
-0.038