Daniocell
si:ch211-102c2.8 (hematopoietic / vasculature)
si:ch211-102c2.8
ZFIN
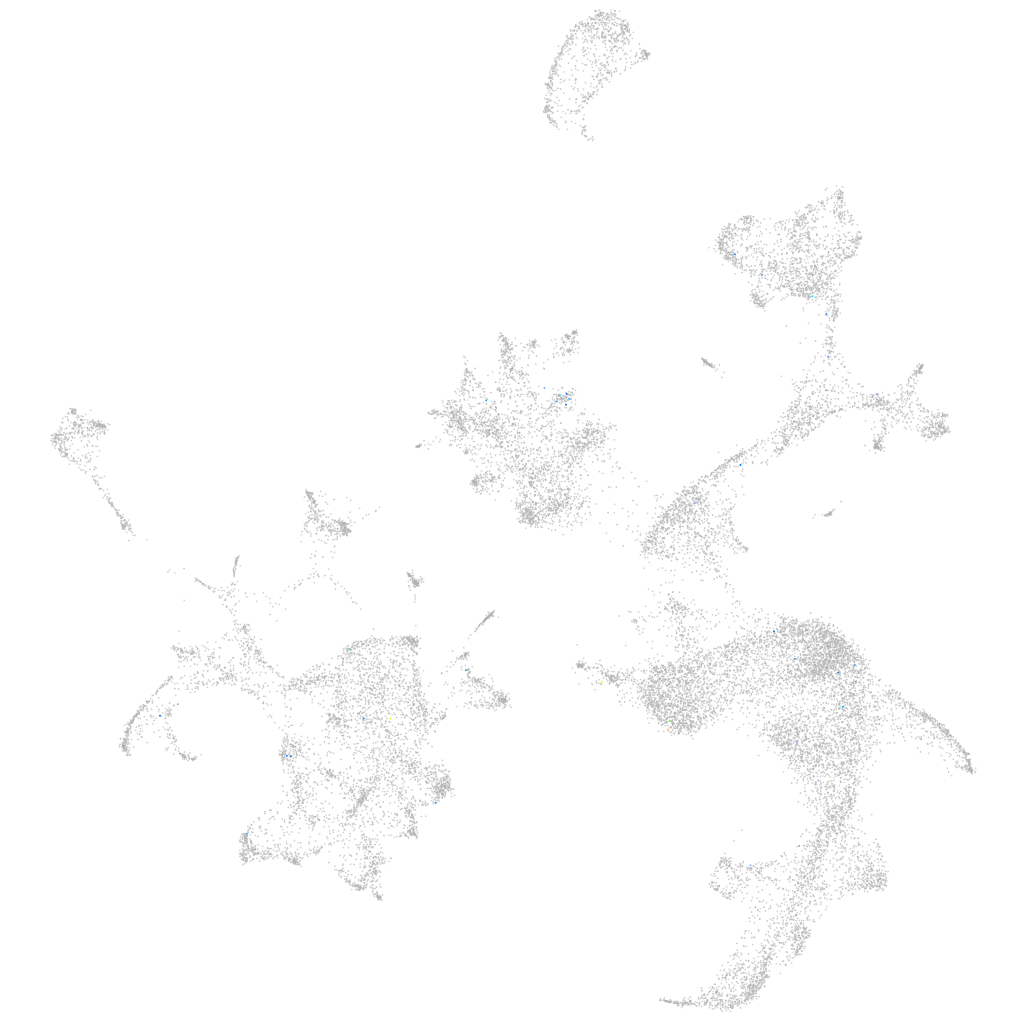
Gene expression UMAP
Display:
Expression
Stage
Other cell groups
all cells
blastomeres
PGCs
endoderm
axial mesoderm
muscle
mural cells /
non-skeletal muscle
mesenchyme
hematopoietic /
vasculature
pronephros
neural
spinal cord / glia
eye
taste / olfactory
otic / lateral line
epidermis
periderm
fin
ionocytes / mucous
pigment cells
Expression by stage/cluster
Correlated gene expression
Positive correlation
Negative correlation
Gene
r
Gene
r
tspan1
0.315
gapdh
-0.012
LOC101886091
0.247
mibp
-0.012
CT990561.2
0.184
myl1
-0.011
mslna
0.156
limch1b
-0.011
kif1cl
0.146
lect2l
-0.011
kiss2
0.141
ccni
-0.011
BX571724.1
0.136
rhd
-0.010
tg
0.133
asb8
-0.010
herc4
0.132
appa
-0.010
si:ch211-130h14.4
0.132
mob2b
-0.010
zgc:112964
0.119
map4k2
-0.010
XLOC-000342
0.117
npsn
-0.010
BX000463.2
0.114
cpa5
-0.010
LOC101882287
0.114
alox5ap
-0.009
hspb7
0.114
lyz
-0.009
si:dkey-47k16.4
0.112
fam198b
-0.009
LOC110437829
0.111
scinlb
-0.009
zgc:100868
0.107
flt1
-0.009
LOC101884285
0.102
pgrmc2
-0.009
vtna
0.101
anxa1c
-0.009
si:dkeyp-50d11.2
0.096
spice1
-0.009
abcd1
0.095
ponzr6
-0.009
si:ch73-226i7.1
0.095
ank1a
-0.009
LOC110438328
0.094
si:ch1073-443f11.2
-0.009
si:dkeyp-11e3.1
0.092
s100a10b
-0.009
p4htm
0.091
cfl1l
-0.009
CU655845.1
0.090
kpna4
-0.009
LOC110438543
0.090
itm2bb
-0.009
epdl2
0.088
mmp13a
-0.009
LOC101883628
0.088
rab11ba
-0.009
AL831745.1
0.086
rbms3
-0.009
tmprss2
0.086
hbae5
-0.009
LOC101887100
0.086
si:ch1073-429i10.1
-0.009
LOC108179116
0.086
pcdh12
-0.009
LOC101883768
0.085
hsd3b7
-0.009