Daniocell
rragcb (pigment cells)
Ras-related GTP binding Cb
ZFIN
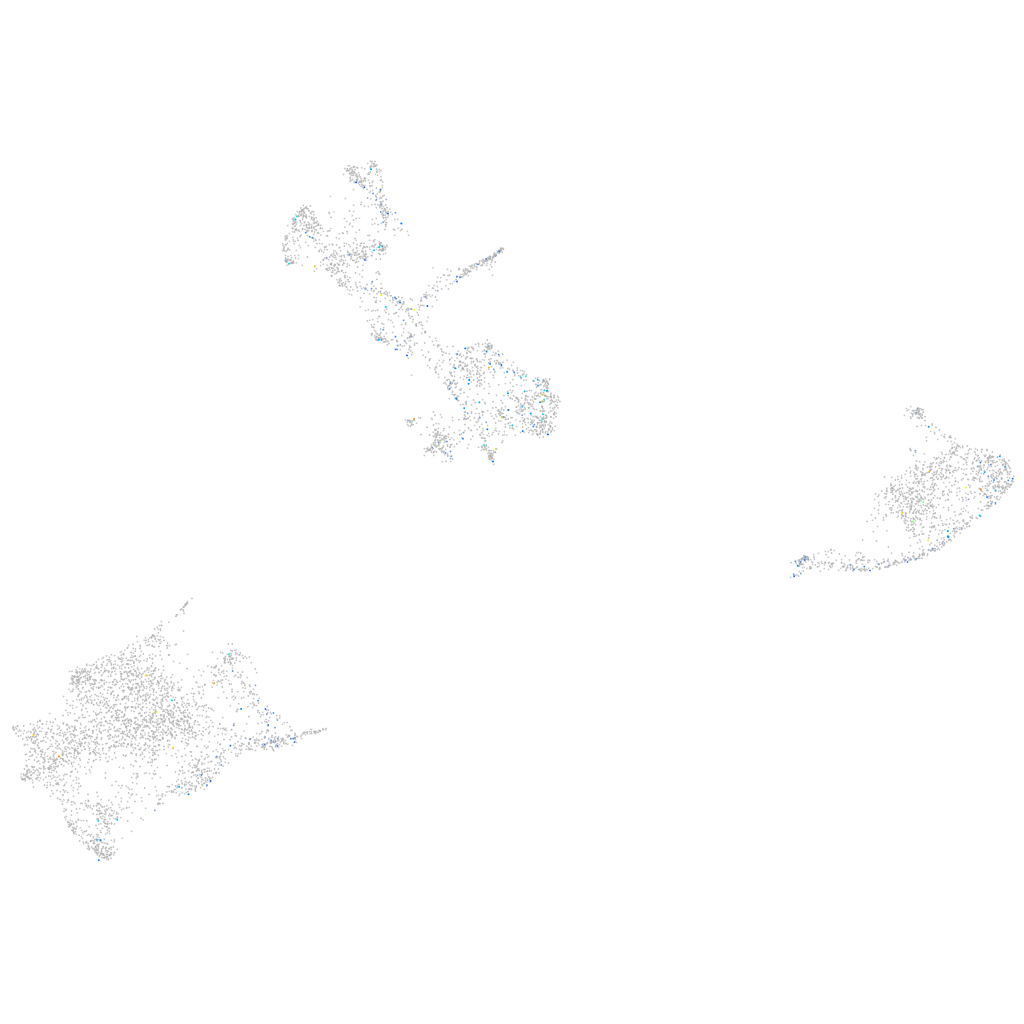
Gene expression UMAP
Display:
Expression
Stage
Other cell groups
all cells
blastomeres
PGCs
endoderm
axial mesoderm
muscle
mural cells /
non-skeletal muscle
mesenchyme
hematopoietic /
vasculature
pronephros
neural
spinal cord / glia
eye
taste / olfactory
otic / lateral line
epidermis
periderm
fin
ionocytes / mucous
pigment cells
Expression by stage/cluster
Correlated gene expression
Positive correlation
Negative correlation
Gene
r
Gene
r
zgc:162936
0.152
si:dkey-251i10.2
-0.071
XLOC-014102
0.143
gstp1
-0.071
zgc:171490
0.142
uraha
-0.070
si:ch1073-181h11.2
0.140
gch2
-0.065
obscna
0.138
zgc:110339
-0.062
LOC101885765
0.137
pts
-0.062
rxfp3
0.134
CABZ01021592.1
-0.061
zgc:172253
0.134
slc22a7a
-0.061
CR847998.1
0.134
akr1b1
-0.053
fam84b
0.133
mdh1aa
-0.046
CR790368.1
0.133
prdx5
-0.045
XLOC-024261
0.125
tmem130
-0.043
gfi1aa
0.123
rpz5
-0.041
si:dkey-33i11.1
0.117
aqp3a
-0.040
rp1l1a
0.116
cyb5a
-0.040
ifit16
0.115
oacyl
-0.040
LOC103910643
0.115
bco1
-0.039
XLOC-042220
0.115
paics
-0.039
CU302253.1
0.112
fbp1a
-0.036
CU074419.1
0.112
si:ch211-251b21.1
-0.035
gaa3-as
0.111
aox5
-0.035
CU469514.1
0.111
ttn.2
-0.034
LOC103909845
0.110
aldob
-0.033
htr3a
0.109
si:ch73-366l1.5
-0.033
hs3st3l
0.107
krt18b
-0.032
si:dkey-263j23.1
0.107
TMEM19
-0.032
CABZ01066921.1
0.104
rplp2
-0.031
CR382383.2
0.104
actb2
-0.030
ungb
0.104
alas1
-0.029
zgc:112966
0.102
rbp4l
-0.029
ros1
0.101
phyhd1
-0.029
ptpra
0.101
mylpfa
-0.028
veph1
0.101
krt8
-0.028
CABZ01067754.1
0.100
gpd1b
-0.028
LOC103910597
0.100
sult1st1
-0.027