Daniocell
rragcb (fin)
Ras-related GTP binding Cb
ZFIN
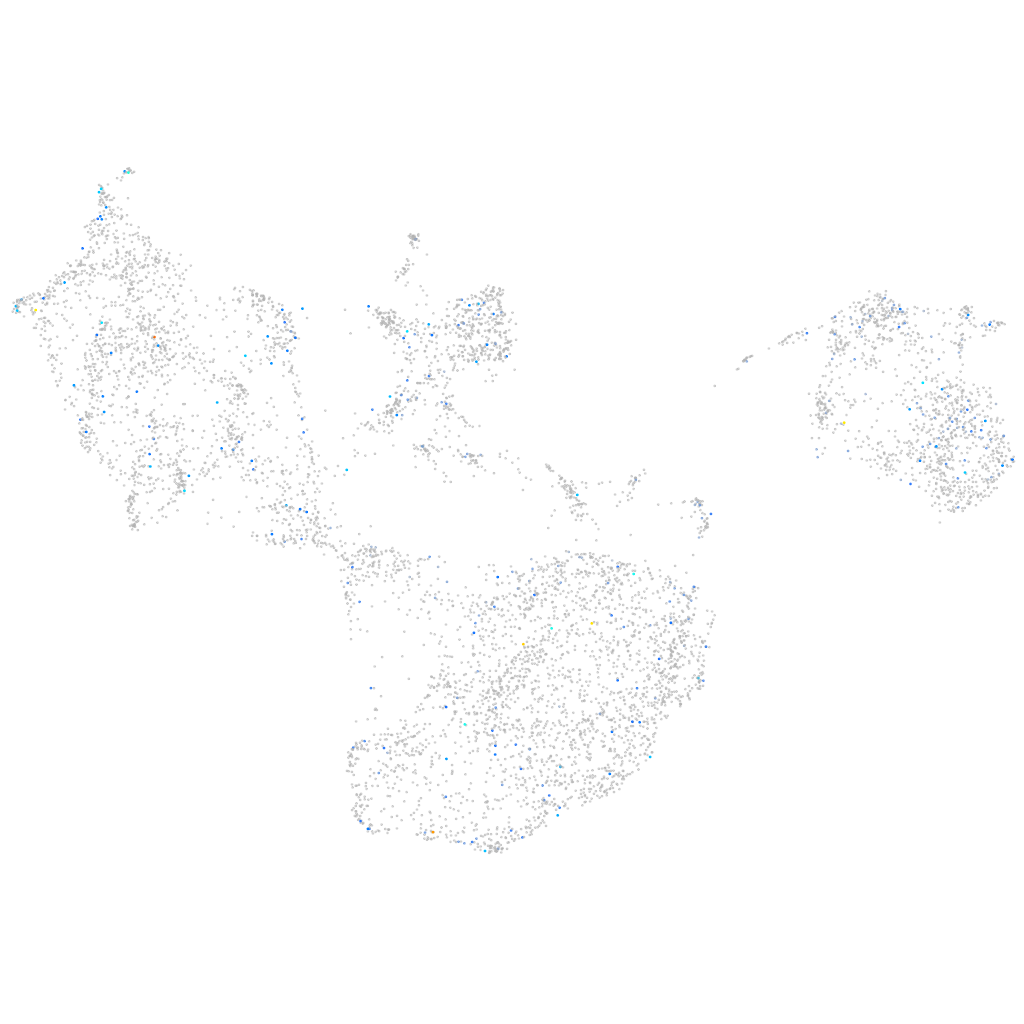
Gene expression UMAP
Display:
Expression
Stage
Other cell groups
all cells
blastomeres
PGCs
endoderm
axial mesoderm
muscle
mural cells /
non-skeletal muscle
mesenchyme
hematopoietic /
vasculature
pronephros
neural
spinal cord / glia
eye
taste / olfactory
otic / lateral line
epidermis
periderm
fin
ionocytes / mucous
pigment cells
Expression by stage/cluster
Correlated gene expression
Positive correlation
Negative correlation
Gene
r
Gene
r
BX537166.1
0.177
aqp3a
-0.031
taar20z
0.173
lgals3b
-0.028
LOC101882645
0.143
hbbe3
-0.028
LOC101883084
0.133
tbc1d5
-0.028
LOC101886950
0.131
CR387919.1
-0.028
LOC110439931
0.130
diabloa
-0.027
enpp7.1
0.124
adcy9
-0.026
th2
0.121
sytl2a
-0.026
si:busm1-52i16.2
0.112
itgb4
-0.026
CABZ01059627.3
0.104
pigx
-0.026
cyp2x12
0.101
atp2a1
-0.025
si:dkey-175g6.2
0.100
efhd2
-0.025
LOC110438288
0.100
itgb1b.2
-0.025
megf8l
0.099
rac2
-0.025
gata6
0.099
waca
-0.025
XLOC-025423
0.098
mrpl36
-0.025
LOC110439332
0.097
rin1a
-0.024
LOC110438291
0.097
cdc42bpb
-0.024
nacad
0.097
reps1
-0.024
si:dkey-225f5.5
0.097
padi2
-0.024
wt1b
0.095
rps10
-0.024
si:ch73-139e5.4
0.093
qpct
-0.024
FO834825.1
0.093
plekha6
-0.023
CABZ01068050.1
0.093
iah1
-0.023
lonrf1
0.091
capgb
-0.023
klf6b
0.091
actc1b
-0.023
si:dkey-285b23.4
0.091
ttn.1
-0.023
ACKR2
0.090
cyp51
-0.023
XLOC-021899
0.089
mocs2
-0.023
snapc3
0.088
dhrs13a.1
-0.023
LOC103910674
0.088
col13a1
-0.023
gdpd4b
0.087
hoxc13b
-0.023
sgms2b
0.086
ecrg4a
-0.023
thsd7ba
0.086
ggh
-0.023
CDH18
0.086
tp63
-0.023