Daniocell
rragcb (pronephros)
Ras-related GTP binding Cb
ZFIN
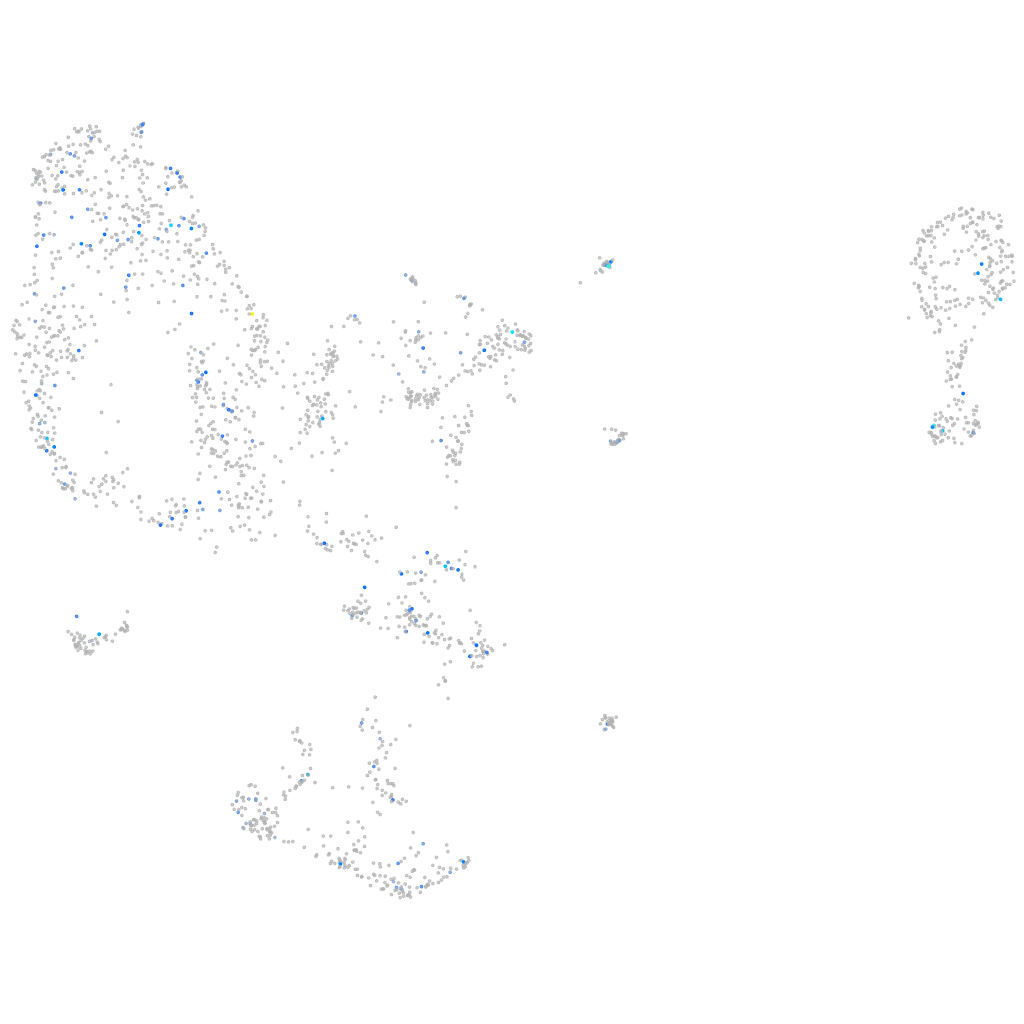
Gene expression UMAP
Display:
Expression
Stage
Other cell groups
all cells
blastomeres
PGCs
endoderm
axial mesoderm
muscle
mural cells /
non-skeletal muscle
mesenchyme
hematopoietic /
vasculature
pronephros
neural
spinal cord / glia
eye
taste / olfactory
otic / lateral line
epidermis
periderm
fin
ionocytes / mucous
pigment cells
Expression by stage/cluster
Correlated gene expression
Positive correlation
Negative correlation
Gene
r
Gene
r
BX005153.2
0.240
cdk11b
-0.054
si:dkey-16p19.1
0.214
zmp:0000000624
-0.049
LOC110438365
0.214
blf
-0.048
zfyve9b
0.201
myhz1.1
-0.048
si:dkey-202e17.1
0.193
cxcl12a
-0.046
XLOC-014659
0.190
hnrnpl2
-0.046
LOC108179692
0.188
sort1a
-0.046
si:ch211-188c18.1
0.188
rgmd
-0.045
zgc:114120
0.188
selenoj
-0.045
TCERG1L
0.187
tbx16
-0.045
BX005380.1
0.185
RSBN1
-0.044
XLOC-028935
0.183
BX927327.1
-0.044
LOC110439526
0.181
fabp7a
-0.043
ttll5
0.178
st3gal3b
-0.042
CABZ01088484.1
0.171
zpr1
-0.041
LOC100006216
0.168
arl4d
-0.041
LO017820.1
0.168
scamp5a
-0.041
slc25a24l
0.167
si:ch73-1a9.3
-0.041
zgc:112332
0.163
khdrbs1b
-0.040
gga3b
0.162
ssbp4
-0.040
LOC101884921
0.161
wdr74
-0.040
si:dkey-175m17.6
0.159
bri3bp
-0.040
LOC110437877
0.158
esf1
-0.040
LOC101882770
0.156
dalrd3
-0.040
GABRR1 (1 of many)
0.156
mlf2
-0.039
moxd1
0.153
dhrs7
-0.039
piwil1
0.151
si:dkey-66i24.9
-0.039
myhb
0.151
kdm6a
-0.039
LOC110438490
0.149
nusap1
-0.039
vwa5b2
0.148
si:dkeyp-121d4.3
-0.039
XRCC2
0.146
deptor
-0.039
smpd3
0.145
cdca7a
-0.039
LOC564237
0.145
ddx54
-0.038
c1qtnf1
0.145
rybpb
-0.038
eogt
0.144
cdx4
-0.038