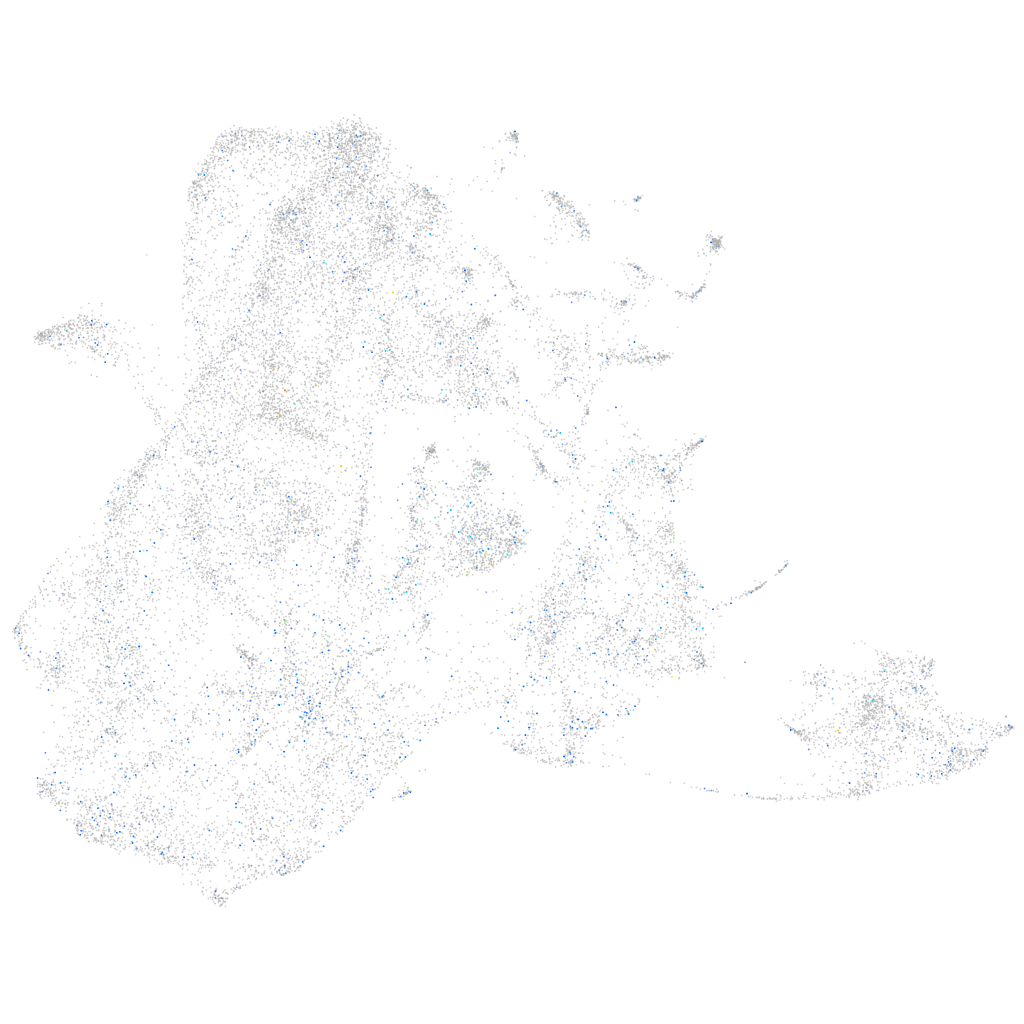
Daniocell
rragcb (epidermis)
Ras-related GTP binding Cb
ZFIN
Gene expression UMAP
Display:
Expression
Stage
Other cell groups
all cells
blastomeres
PGCs
endoderm
axial mesoderm
muscle
mural cells /
non-skeletal muscle
mesenchyme
hematopoietic /
vasculature
pronephros
neural
spinal cord / glia
eye
taste / olfactory
otic / lateral line
epidermis
periderm
fin
ionocytes / mucous
pigment cells
Expression by stage/cluster
Correlated gene expression
Positive correlation
Negative correlation
Gene
r
Gene
r
crygm2d16
0.115
pfn1
-0.060
CU468723.2
0.106
tmsb1
-0.057
XLOC-032764
0.097
s100a10b
-0.056
LOC101884509
0.094
krt4
-0.056
CDH18
0.081
cyt1
-0.055
chia.1
0.078
rbp4
-0.055
XLOC-004483
0.078
cfl1l
-0.054
si:ch73-72b7.1
0.076
col1a1b
-0.054
CABZ01086574.1
0.073
col1a1a
-0.052
CU693479.1
0.069
col11a1a
-0.052
mapk8ip2
0.068
col1a2
-0.050
LO017845.1
0.068
krtt1c19e
-0.050
LOC110437877
0.067
krt5
-0.049
nav1b
0.066
postnb
-0.049
si:ch73-62b13.1
0.063
spaca4l
-0.049
prickle2a
0.062
cotl1
-0.048
gabra6b
0.062
cxl34b.11
-0.047
porcn
0.062
cyt1l
-0.047
hnrnpaba
0.062
tmsb4x
-0.046
zgc:173915
0.061
col2a1b
-0.046
fmnl1a
0.061
krt91
-0.045
CU694317.1
0.061
anxa1a
-0.045
hmgn6
0.061
si:dkey-33c14.3
-0.044
cirbpb
0.060
cldn1
-0.044
nlrb5
0.060
thy1
-0.044
inpp5jb
0.060
aep1
-0.044
LOC100330250
0.060
ecrg4b
-0.044
NC-002333.5
0.059
itgav
-0.044
mtnr1al
0.058
si:dkey-16p21.8
-0.043
marcksl1a
0.058
si:dkey-183i3.5
-0.043
smarce1
0.058
zgc:136930
-0.042
syncrip
0.058
hcls1
-0.042
LOC795227
0.058
col14a1b
-0.042
h2afva
0.057
sparc
-0.041
rbbp4
0.057
capns1a
-0.041