Daniocell
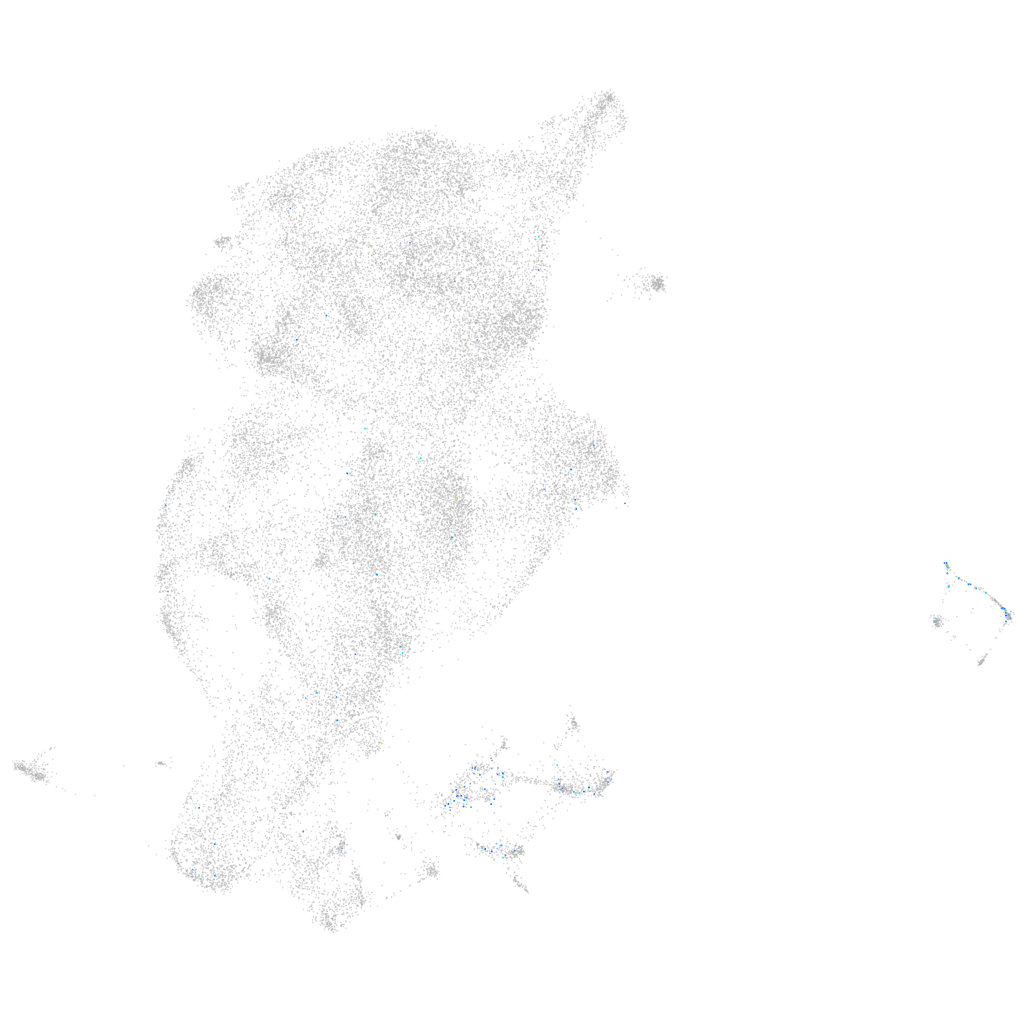
pebp1 (periderm)
phosphatidylethanolamine binding protein 1
ZFIN
Gene expression UMAP
Display:
Expression
Stage
Other cell groups
all cells
blastomeres
PGCs
endoderm
axial mesoderm
muscle
mural cells /
non-skeletal muscle
mesenchyme
hematopoietic /
vasculature
pronephros
neural
spinal cord / glia
eye
taste / olfactory
otic / lateral line
epidermis
periderm
fin
ionocytes / mucous
pigment cells
Expression by stage/cluster
Correlated gene expression
Positive correlation
Negative correlation
Gene
r
Gene
r
BX322608.1
0.148
cyt1
-0.100
hmgb1b
0.140
si:ch211-195b11.3
-0.079
ungb
0.137
icn2
-0.075
gtf3ab
0.133
krt4
-0.067
XLOC-014490
0.133
wu:fb18f06
-0.064
crha
0.132
rpl37
-0.061
si:ch211-63p21.2
0.132
rplp2
-0.057
si:ch73-233f7.8
0.132
selenow1
-0.057
CR450793.1
0.130
rps10
-0.056
LOC101884857
0.129
cyt1l
-0.056
marcksb
0.129
tob1b
-0.053
ftr11
0.127
anxa1a
-0.052
cldnd
0.127
zgc:114188
-0.052
cx43.4
0.126
si:ch211-105c13.3
-0.050
XLOC-001437
0.126
scel
-0.049
marcksl1b
0.123
krt5
-0.048
acp5a
0.122
icn
-0.047
zgc:77118
0.122
aldob
-0.047
gdf3
0.121
rpl28
-0.047
aif1l
0.121
rpl26
-0.046
tdrd7a
0.118
krt17
-0.046
h1m
0.118
pnp5a
-0.045
BX005461.1
0.117
ier2b
-0.045
zgc:173742
0.117
wu:fa03e10
-0.044
msna
0.117
si:ch211-207n23.2
-0.043
LOC101887064
0.115
s100a10b
-0.042
si:ch211-145c1.1
0.113
rpl36a
-0.042
si:dkey-223p19.2
0.112
mgst1.2
-0.041
LOC103911160
0.112
ckap4
-0.041
BX465205.2
0.111
rpl31
-0.040
nanog
0.111
rplp1
-0.040
si:ch211-222l21.1
0.111
rplp0
-0.040
si:ch211-133n4.4
0.110
si:ch73-52f15.5
-0.040
btg4
0.110
mcl1a
-0.040
rundc3b
0.109
rps23
-0.040