Daniocell
pebp1 (pigment cells)
phosphatidylethanolamine binding protein 1
ZFIN
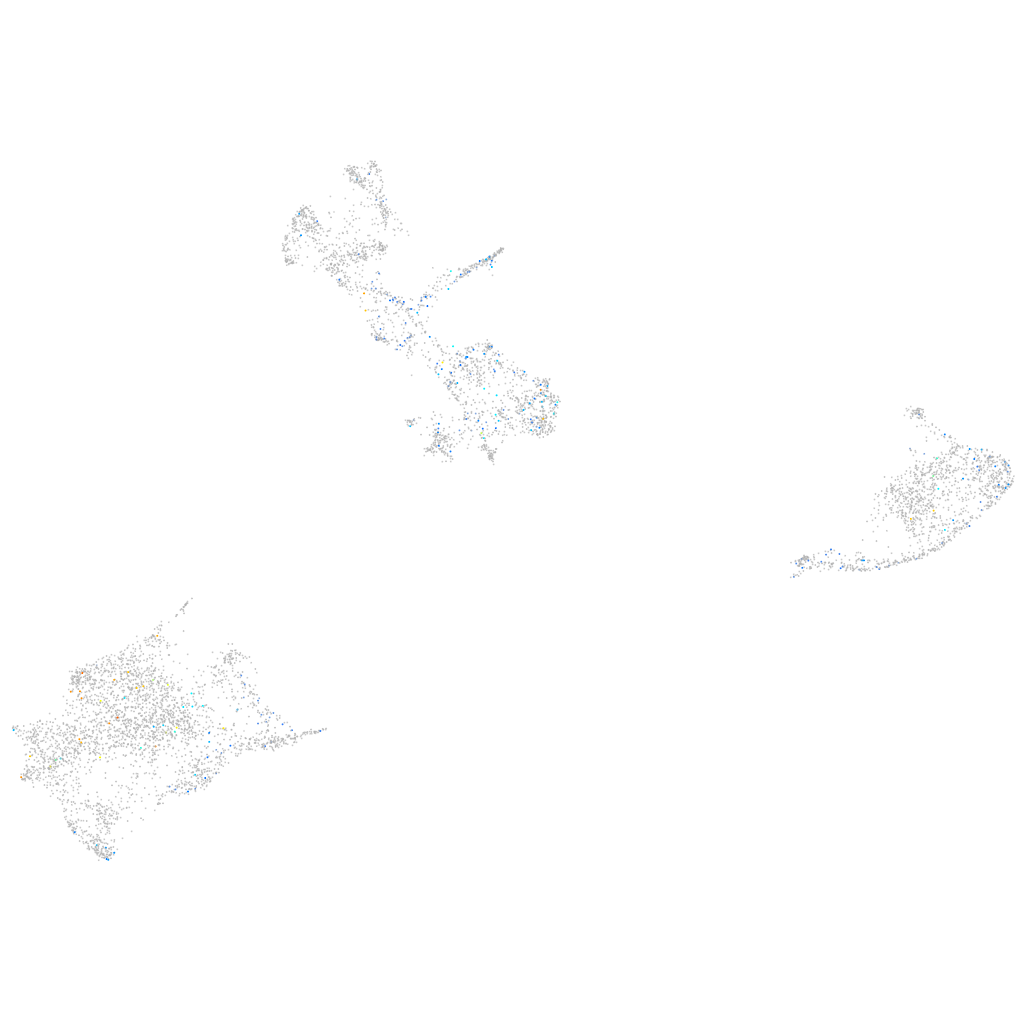
Gene expression UMAP
Display:
Expression
Stage
Other cell groups
all cells
blastomeres
PGCs
endoderm
axial mesoderm
muscle
mural cells /
non-skeletal muscle
mesenchyme
hematopoietic /
vasculature
pronephros
neural
spinal cord / glia
eye
taste / olfactory
otic / lateral line
epidermis
periderm
fin
ionocytes / mucous
pigment cells
Expression by stage/cluster
Correlated gene expression
Positive correlation
Negative correlation
Gene
r
Gene
r
XLOC-008602
0.155
pvalb2
-0.044
ryr2a
0.132
ivns1abpa
-0.039
XLOC-002521
0.129
LOC103910009
-0.038
CABZ01111959.1
0.119
opn5
-0.038
slc18a3b
0.118
nme2b.2
-0.036
paqr5b
0.107
akap12a
-0.036
mthfd2l
0.106
mylpfb
-0.036
aqp9a
0.104
xdh
-0.034
FQ377918.1
0.103
FP085398.1
-0.034
XLOC-044287
0.100
agtrap
-0.033
zgc:154064
0.099
fbp1a
-0.033
si:ch211-233h19.2
0.097
ahnak
-0.032
LOC100332187
0.097
bhlhe41
-0.031
sult3st3
0.095
kitlga
-0.031
sycn.1
0.091
CABZ01072077.1
-0.031
LOC110439948
0.090
syngr1a
-0.031
si:ch211-208f21.2
0.090
tpd52l1
-0.031
BX908401.1
0.089
col4a1
-0.031
si:dkeyp-100a5.4
0.089
zgc:110239
-0.030
epha4l
0.088
sparc
-0.030
si:ch211-198c19.3
0.086
rab38
-0.030
hivep2b
0.086
atp6v1d
-0.030
si:ch73-14h10.2
0.086
slc38a5b
-0.030
prkag2b
0.085
rhag
-0.030
CR293509.1
0.085
palm2
-0.029
smpd3
0.085
rab27a
-0.029
cps1
0.084
atp11a
-0.029
c15h3orf80
0.083
mroh1
-0.029
XLOC-004437
0.083
trpm1b
-0.029
zgc:91860
0.083
cebpd
-0.029
si:dkey-221l4.10
0.081
serpine2
-0.029
BX511021.4
0.080
CT737162.3
-0.028
timp4.1
0.080
prkar1aa
-0.028
FP245458.1
0.079
lama4
-0.028
LOC100000890
0.079
pax7a
-0.028