Daniocell
pebp1 (pronephros)
phosphatidylethanolamine binding protein 1
ZFIN
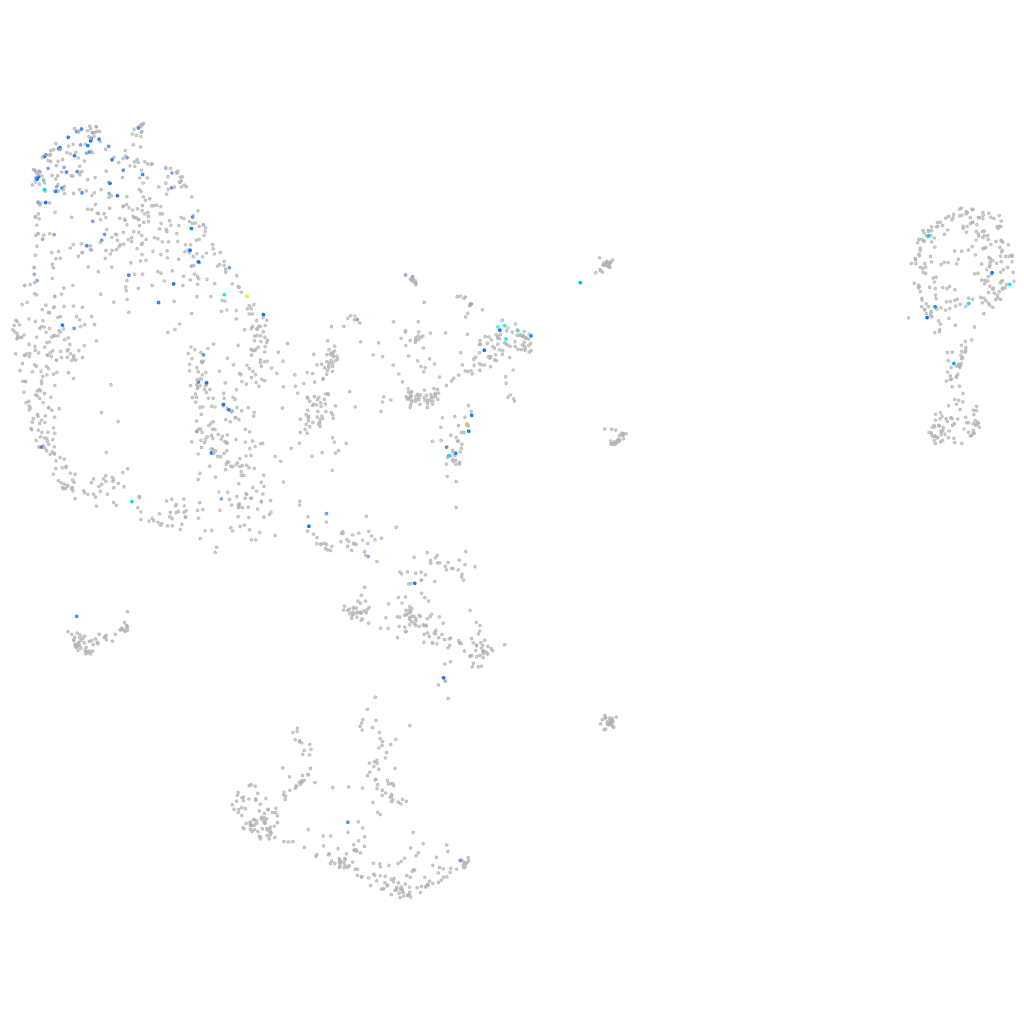
Gene expression UMAP
Display:
Expression
Stage
Other cell groups
all cells
blastomeres
PGCs
endoderm
axial mesoderm
muscle
mural cells /
non-skeletal muscle
mesenchyme
hematopoietic /
vasculature
pronephros
neural
spinal cord / glia
eye
taste / olfactory
otic / lateral line
epidermis
periderm
fin
ionocytes / mucous
pigment cells
Expression by stage/cluster
Correlated gene expression
Positive correlation
Negative correlation
Gene
r
Gene
r
tmem119a
0.281
cldnh
-0.101
XLOC-030238
0.275
krt18a.1
-0.092
CDHR1 (1 of many)
0.223
anxa4
-0.092
si:ch1073-391i24.1
0.208
cers3b
-0.089
BX539313.1
0.208
mycbp
-0.084
erfl1
0.207
tpm4a
-0.084
tbx21
0.205
ccdc173
-0.084
ppp2r2cb
0.204
cd9b
-0.084
zgc:111868
0.202
si:ch211-248e11.2
-0.083
fgf13a
0.200
elf3
-0.083
ephb1
0.199
malb
-0.082
KCNV1
0.194
gdpd3a
-0.080
gpr185a
0.193
zgc:86598
-0.079
MGAT5B
0.193
smkr1
-0.078
crygmx
0.192
si:ch211-222l21.1
-0.077
ric1
0.191
epcam
-0.077
BX088587.1
0.191
phlda2
-0.076
si:ch73-362m14.4
0.191
cnn2
-0.075
lhfpl3
0.191
ift27
-0.075
CU929144.1
0.189
sparc
-0.074
grm3
0.186
dpcd
-0.073
XLOC-023704
0.186
meig1
-0.073
col8a1b
0.186
si:dkey-42p14.3
-0.072
slc1a3b
0.186
aldoaa
-0.071
LO018303.1
0.185
cldnc
-0.071
ARF5
0.185
abracl
-0.071
FP016234.1
0.184
erich2
-0.070
XLOC-033543
0.180
foxj1a
-0.070
si:dkeyp-72h1.1
0.180
cetn4
-0.070
BX571681.3
0.179
spata4
-0.069
cthl
0.177
emc2
-0.069
neurod6a
0.177
si:ch211-163l21.7
-0.069
CEP170B (1 of many)
0.176
arpc4l
-0.069
her4.3
0.175
LOC103911624
-0.068
si:ch211-172l8.4
0.175
nupr1a
-0.068