Daniocell
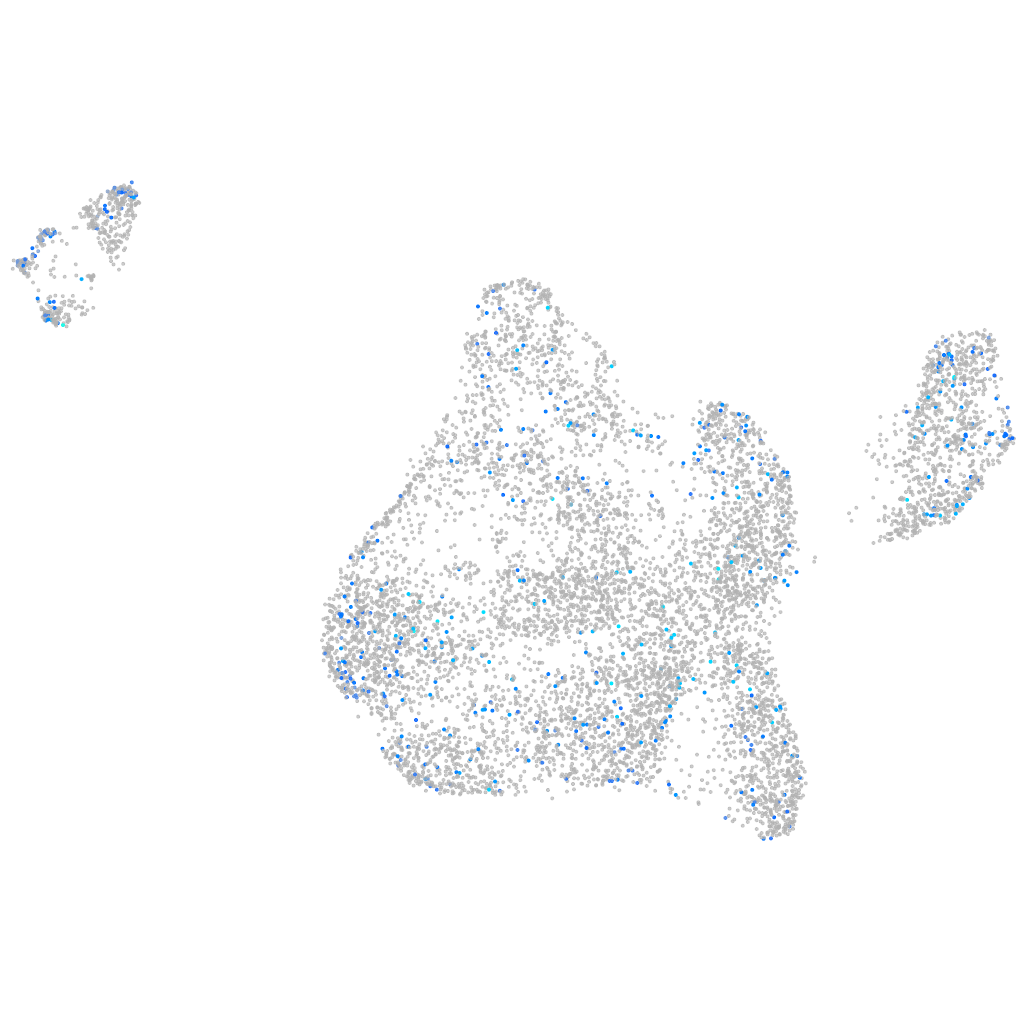
pebp1 (blastomeres)
phosphatidylethanolamine binding protein 1
ZFIN
Gene expression UMAP
Display:
Expression
Stage
Other cell groups
all cells
blastomeres
PGCs
endoderm
axial mesoderm
muscle
mural cells /
non-skeletal muscle
mesenchyme
hematopoietic /
vasculature
pronephros
neural
spinal cord / glia
eye
taste / olfactory
otic / lateral line
epidermis
periderm
fin
ionocytes / mucous
pigment cells
Expression by stage/cluster
Correlated gene expression
Positive correlation
Negative correlation
Gene
r
Gene
r
BX950865.1
0.091
hspb1
-0.049
ednraa
0.078
ptmab
-0.047
ttc41
0.078
marcksl1b
-0.044
LOC103910163
0.077
si:ch73-1a9.3
-0.044
XLOC-042917
0.076
dynll1
-0.042
CT737123.1
0.074
hmgb2a
-0.041
galr2b
0.073
si:ch211-222l21.1
-0.040
LOC100332070
0.070
ybx1
-0.039
gabrb1
0.070
cdx4
-0.038
pglyrp2
0.069
hnrnpa0b
-0.038
LOC108184018
0.069
hmga1a
-0.038
nanog
0.068
eef1a1l1
-0.037
ccna1
0.067
stm
-0.036
h2af1al
0.067
rplp1
-0.036
BX120005.1
0.067
rpl7a
-0.035
nudt5
0.066
si:ch211-137a8.4
-0.035
styk1a
0.066
polr2c
-0.034
CR788322.1
0.065
hmgn2
-0.033
stx5a
0.065
anp32e
-0.033
LOC795227
0.065
NC-002333.4
-0.032
BX324153.1
0.064
mrto4
-0.032
disp1
0.064
auts2b
-0.032
CR788254.1
0.064
rps5
-0.032
si:ch211-102c2.7
0.063
ptges3b
-0.032
si:ch211-119e14.1
0.062
serpinh1b
-0.031
zgc:113343
0.061
h2afvb
-0.031
LOC101886256
0.061
rpl27
-0.030
aff2
0.061
LOC101884747
-0.030
si:dkey-151p11.2
0.061
rps20
-0.030
fgf11a
0.061
rps27a
-0.029
CR855393.1
0.061
myl9b
-0.029
tlr19
0.060
si:dkey-92i17.2
-0.029
rp2
0.060
epha2a
-0.029
si:dkey-193b15.8
0.059
si:dkey-256i11.2
-0.029
CU972516.1
0.059
npm1a
-0.029