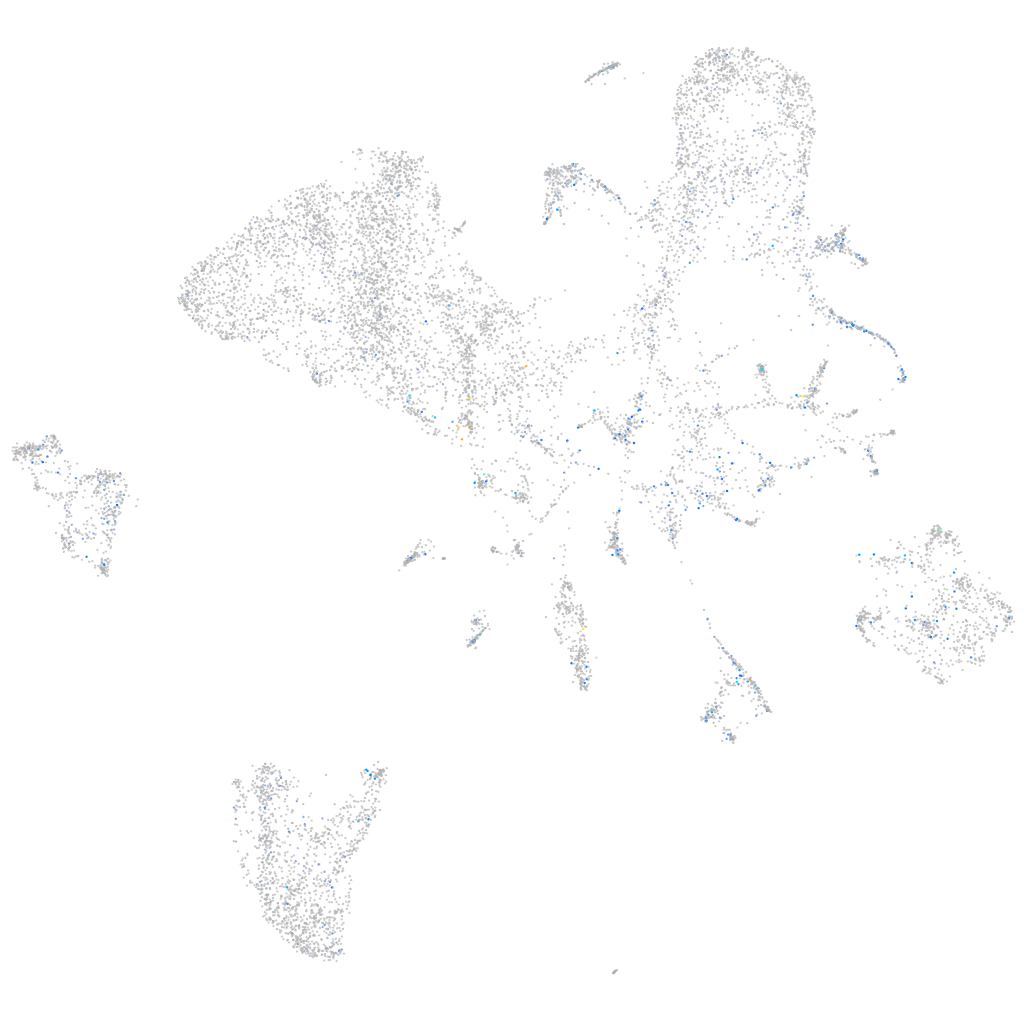
Daniocell
mark3b (endoderm)
MAP/microtubule affinity-regulating kinase 3b
ZFIN
Gene expression UMAP
Display:
Expression
Stage
Other cell groups
all cells
blastomeres
PGCs
endoderm
axial mesoderm
muscle
mural cells /
non-skeletal muscle
mesenchyme
hematopoietic /
vasculature
pronephros
neural
spinal cord / glia
eye
taste / olfactory
otic / lateral line
epidermis
periderm
fin
ionocytes / mucous
pigment cells
Expression by stage/cluster
Correlated gene expression
Positive correlation
Negative correlation
Gene
r
Gene
r
togaram1
0.163
gamt
-0.097
herc7
0.163
apoa4b.1
-0.093
CABZ01088025.1
0.162
gatm
-0.090
lrrc7
0.159
apoc2
-0.090
XLOC-043782
0.159
apoa1b
-0.088
LOC103909937
0.152
afp4
-0.083
XLOC-042515
0.140
ahcy
-0.083
pcdh1g14
0.140
fbp1b
-0.082
klhl40b
0.140
pnp4b
-0.081
LOC100334612
0.138
zgc:123103
-0.081
si:ch211-76l23.4
0.137
apom
-0.081
si:dkey-27b3.4
0.136
gpx4a
-0.081
si:ch211-264f5.8
0.132
apobb.1
-0.080
XLOC-042707
0.131
gapdh
-0.080
tmbim1b
0.130
agxtb
-0.080
eva1bb
0.129
ttr
-0.079
rinl
0.127
mgst1.2
-0.079
LO017650.1
0.127
ces2
-0.079
osbpl3b
0.126
gc
-0.078
BX908731.1
0.125
bhmt
-0.078
ttbk1a
0.125
apoa2
-0.078
LOC101884484
0.124
fabp10a
-0.077
XLOC-042909
0.121
igfbp2a
-0.077
zgc:92912
0.120
apoc1
-0.077
kcnk10a
0.118
rbp2b
-0.077
si:rp71-1i20.2
0.115
serpina1l
-0.077
cx32.2
0.115
suclg1
-0.076
adgre10
0.114
serpinc1
-0.076
runx2b
0.114
grhprb
-0.076
zdhhc2
0.113
cyp2n13
-0.075
zgc:113274
0.112
uox
-0.075
si:ch73-338o16.4
0.111
mdh1aa
-0.075
zgc:112408
0.111
fetub
-0.075
si:dkey-108k24.2
0.111
scp2a
-0.075
LOC101884506
0.110
ambp
-0.075