Daniocell
mark3b (axial mesoderm)
MAP/microtubule affinity-regulating kinase 3b
ZFIN
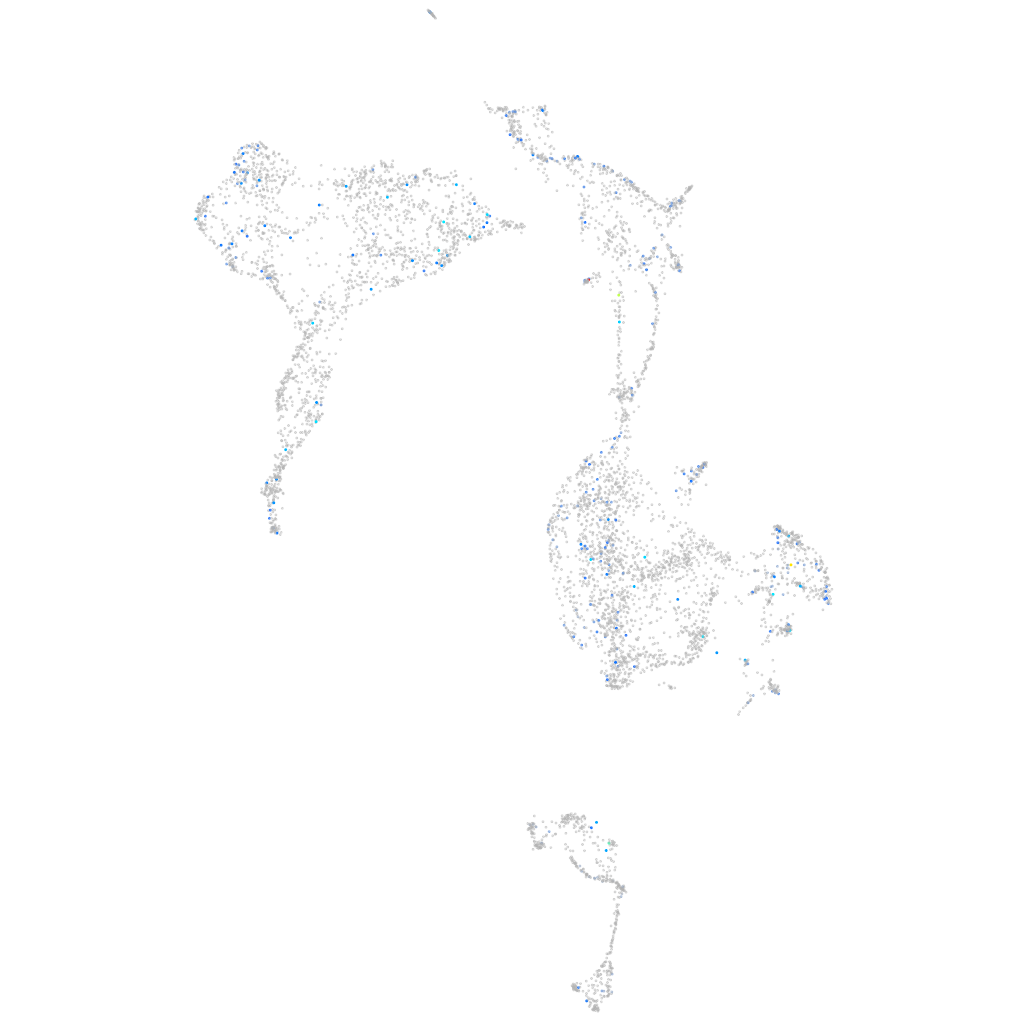
Gene expression UMAP
Display:
Expression
Stage
Other cell groups
all cells
blastomeres
PGCs
endoderm
axial mesoderm
muscle
mural cells /
non-skeletal muscle
mesenchyme
hematopoietic /
vasculature
pronephros
neural
spinal cord / glia
eye
taste / olfactory
otic / lateral line
epidermis
periderm
fin
ionocytes / mucous
pigment cells
Expression by stage/cluster
Correlated gene expression
Positive correlation
Negative correlation
Gene
r
Gene
r
colq
0.274
lft2
-0.044
slc4a5a
0.200
xbp1
-0.035
grin1a
0.190
ell2
-0.035
crlf1b
0.184
znf207b
-0.034
tpcn1
0.182
thumpd3
-0.033
frrs1a
0.172
BX088707.1
-0.033
si:ch73-29l19.1
0.157
slc39a10
-0.032
TMEM179 (1 of many)
0.156
BX957362.1
-0.032
bbs2
0.155
lin9
-0.032
si:ch211-149b19.2
0.145
frzb
-0.031
BX571942.1
0.143
fzd8a
-0.031
ankrd33bb
0.136
tmcc3
-0.031
XLOC-044113
0.134
mad2l1
-0.031
gria3a
0.131
si:dkey-83k24.5
-0.030
trim35-10
0.130
slc7a6os
-0.030
hmgcra
0.127
chrd
-0.029
CU694255.2
0.126
klf17
-0.029
abcd2
0.124
si:dkey-239h2.3
-0.029
si:ch73-215d9.1
0.123
hnrnph3
-0.029
pygma
0.122
chordc1a
-0.028
CT027756.3
0.120
fzd8b
-0.028
tnfsf11
0.119
six3b
-0.028
cox18
0.119
bud23
-0.028
zgc:152951
0.117
gsc
-0.028
tmem91
0.117
slc12a7a
-0.028
rnf166
0.117
cldnh
-0.028
LOC101882529
0.116
arl4ab
-0.028
osbp
0.116
sytl4
-0.028
prkar2ab
0.114
si:dkey-42i9.6
-0.027
hspb11
0.114
si:ch1073-70f20.1
-0.027
vcla
0.113
trmt6
-0.027
rab11fip2
0.111
srsf2b
-0.027
LOC108179220
0.111
zgc:171599
-0.027
asb5a
0.110
lft1
-0.027
dctn1b
0.109
zfand5a
-0.026