Daniocell
mark3b (periderm)
MAP/microtubule affinity-regulating kinase 3b
ZFIN
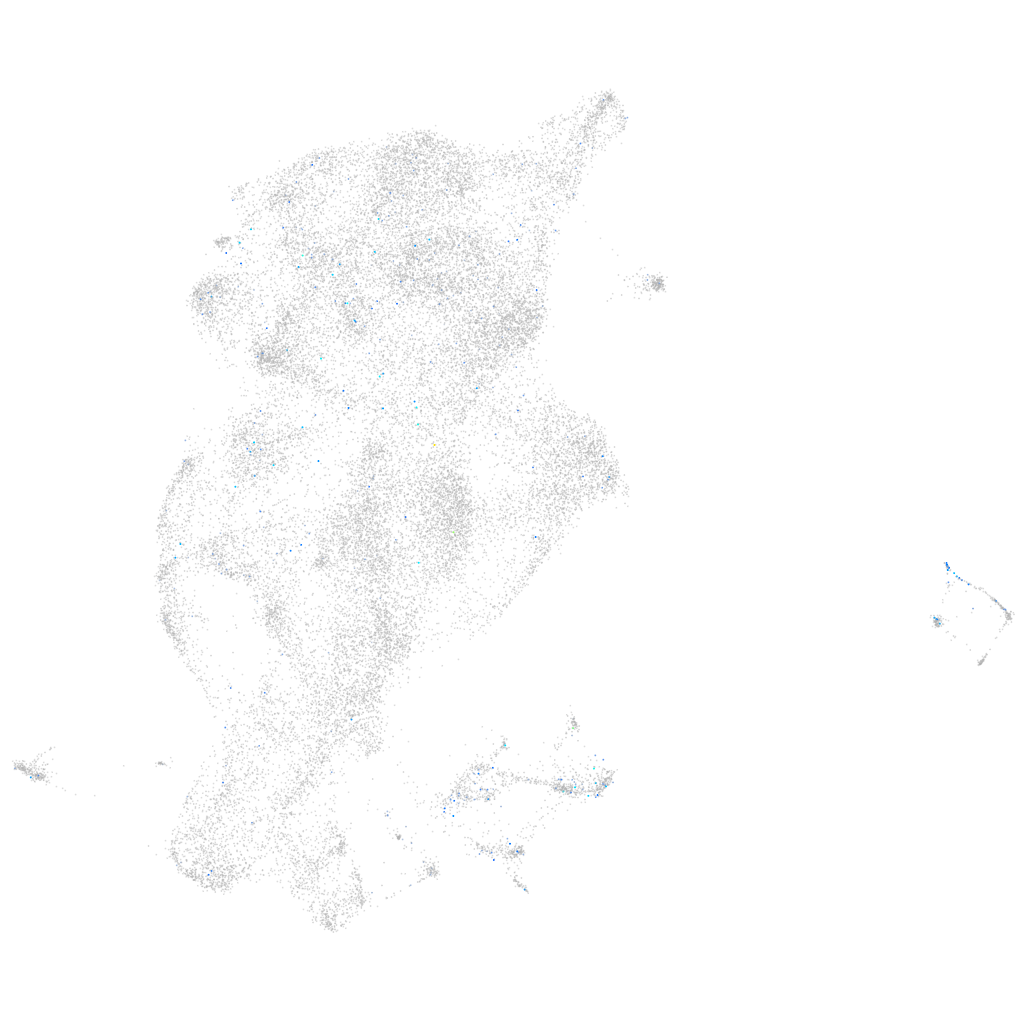
Gene expression UMAP
Display:
Expression
Stage
Other cell groups
all cells
blastomeres
PGCs
endoderm
axial mesoderm
muscle
mural cells /
non-skeletal muscle
mesenchyme
hematopoietic /
vasculature
pronephros
neural
spinal cord / glia
eye
taste / olfactory
otic / lateral line
epidermis
periderm
fin
ionocytes / mucous
pigment cells
Expression by stage/cluster
Correlated gene expression
Positive correlation
Negative correlation
Gene
r
Gene
r
BX664625.3
0.155
cyt1
-0.090
cx52.7
0.135
krt4
-0.083
kcnj2b
0.134
wu:fb18f06
-0.078
MINAR1
0.134
icn
-0.077
gdf3
0.133
icn2
-0.072
BX897741.1
0.129
si:ch211-195b11.3
-0.067
senp6b
0.125
agr1
-0.065
BX569779.1
0.125
cyt1l
-0.064
trhde.2
0.120
zgc:193505
-0.063
XLOC-005983
0.117
s100a10b
-0.062
zgc:163014
0.117
cst14b.1
-0.061
plekhd1
0.115
si:ch211-157c3.4
-0.056
btg4
0.113
tmsb1
-0.056
si:ch73-299h12.2
0.113
capns1a
-0.054
LOC110438269
0.113
cfl1l
-0.054
zgc:100951
0.113
anxa1c
-0.053
si:ch211-156l18.8
0.112
anxa1a
-0.051
opn9
0.112
krt5
-0.048
CABZ01053976.1
0.112
s100w
-0.047
cldnd
0.112
ppl
-0.046
zgc:66472
0.111
zgc:175088
-0.044
gtf3ab
0.111
mgst1.2
-0.043
zgc:173742
0.108
zgc:174938
-0.043
fam131c
0.107
gsnb
-0.042
klhdc8a
0.106
zgc:153284
-0.042
lrrc30a
0.105
si:cabz01007794.1
-0.040
LOC101882989
0.105
smdt1b
-0.040
si:dkey-68o6.5
0.105
ckap4
-0.040
XLOC-044290
0.103
pycard
-0.040
acp5a
0.103
ywhabl
-0.039
slc4a5a
0.103
capn9
-0.038
BX936447.1
0.102
anxa2a
-0.038
h1m
0.101
gstp1
-0.038
ica1
0.100
ANXA1 (1 of many)
-0.037
LOC101885479.1
0.100
zgc:153665
-0.037