Daniocell
mark3b (fin)
MAP/microtubule affinity-regulating kinase 3b
ZFIN
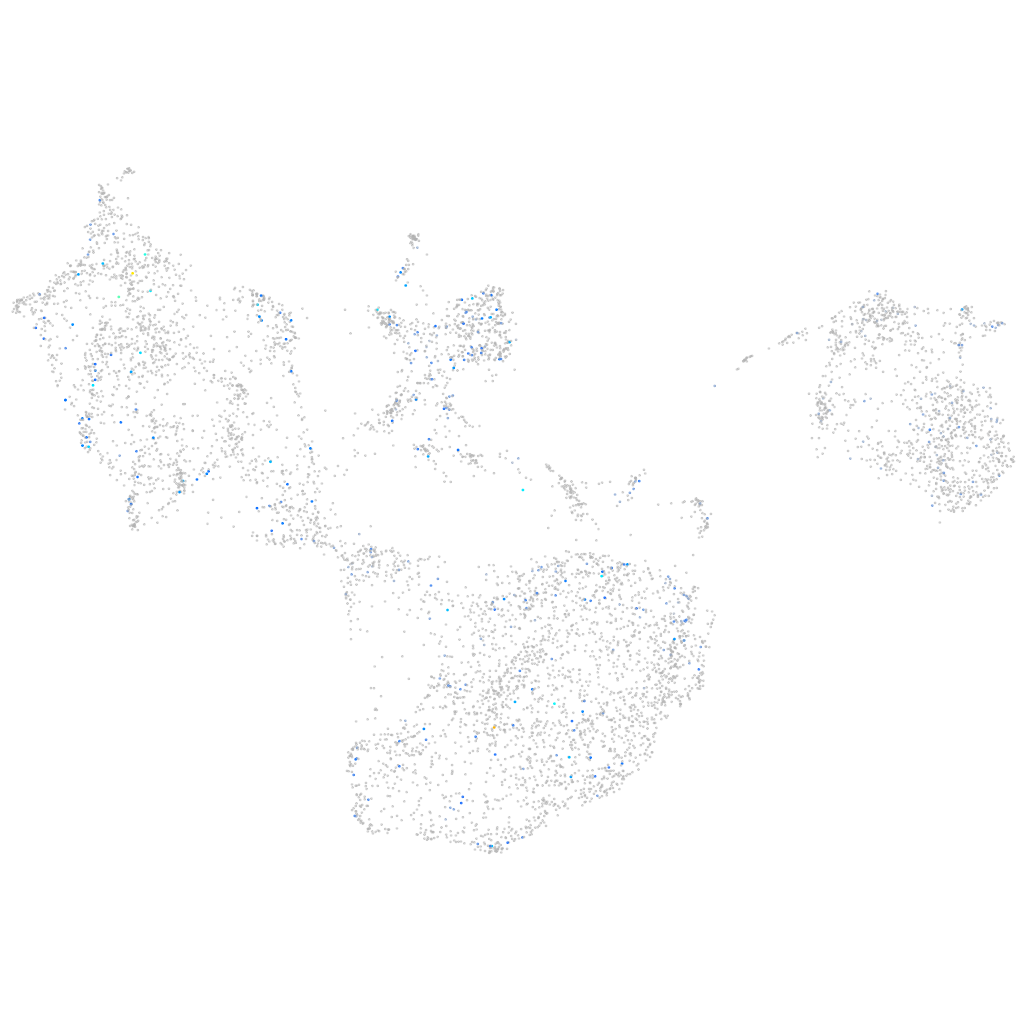
Gene expression UMAP
Display:
Expression
Stage
Other cell groups
all cells
blastomeres
PGCs
endoderm
axial mesoderm
muscle
mural cells /
non-skeletal muscle
mesenchyme
hematopoietic /
vasculature
pronephros
neural
spinal cord / glia
eye
taste / olfactory
otic / lateral line
epidermis
periderm
fin
ionocytes / mucous
pigment cells
Expression by stage/cluster
Correlated gene expression
Positive correlation
Negative correlation
Gene
r
Gene
r
LOC101884473
0.141
krt17
-0.041
zgc:152968
0.135
cyt1l
-0.040
LOC101885857
0.129
scel
-0.039
LOC110439538
0.127
cyt1
-0.038
CU929544.1
0.127
cldn1
-0.038
CABZ01067150.1
0.125
rbp4
-0.035
LOC108191314
0.121
b4galt1l
-0.035
LOC110440083
0.121
epcam
-0.035
CABZ01022564.1
0.121
tmem79b
-0.035
si:dkeyp-7a3.1
0.120
amd1
-0.035
CABZ01043166.1
0.116
si:ch211-195b11.3
-0.034
plcb4
0.113
icn
-0.034
c8h22orf15
0.112
tmem176l.4
-0.033
lrrc18b
0.112
anxa1c
-0.033
si:ch211-110p13.9
0.112
cfl1l
-0.033
mrap2b
0.112
cast
-0.032
si:dkey-87k14.1
0.110
arhgef5
-0.032
tgm1l2
0.109
wu:fb18f06
-0.032
mitfa
0.108
krt4
-0.032
zgc:174315
0.107
spint2
-0.032
si:dkey-237j11.3
0.106
agr1
-0.032
LOC103909463
0.106
rplp2
-0.032
si:ch211-272b8.6
0.105
tmsb1
-0.031
im:7140055
0.103
si:dkey-33c14.3
-0.031
cacna1sb
0.102
tmem45b
-0.031
si:ch1073-513e17.1
0.102
evpla
-0.031
si:ch211-261a10.5
0.101
abcb5
-0.031
si:dkey-1h6.8
0.100
ecrg4b
-0.031
kcnc2
0.100
si:ch211-105j21.9
-0.031
drd3
0.099
pfn1
-0.031
cabp2b
0.098
zgc:193505
-0.031
adgrg4a
0.097
si:dkey-247k7.2
-0.030
LOC103909874
0.096
si:dkey-221j11.3
-0.030
si:ch211-103a14.5
0.096
arrdc2
-0.030
si:dkeyp-121d2.7
0.095
xkr8.2
-0.030