Daniocell
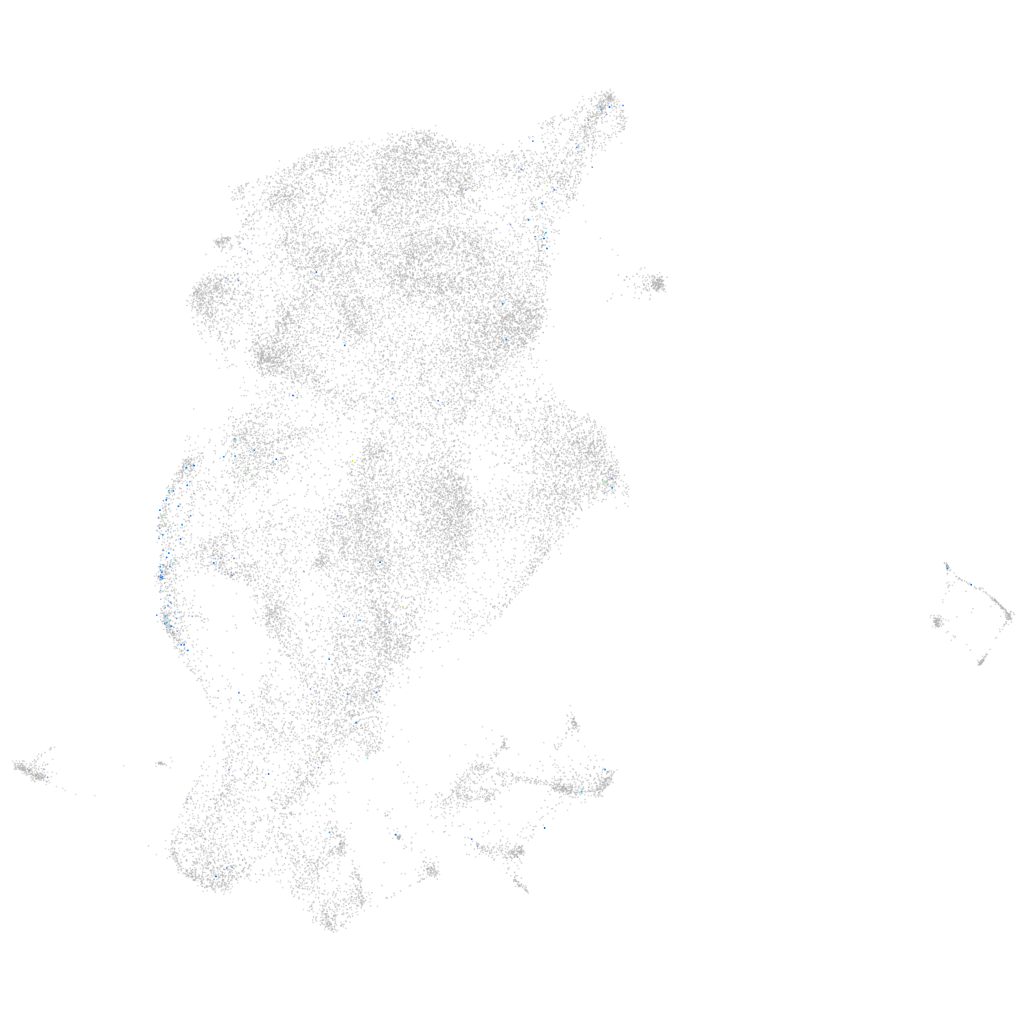
hpse2 (periderm)
heparanase 2
ZFIN
Gene expression UMAP
Display:
Expression
Stage
Other cell groups
all cells
blastomeres
PGCs
endoderm
axial mesoderm
muscle
mural cells /
non-skeletal muscle
mesenchyme
hematopoietic /
vasculature
pronephros
neural
spinal cord / glia
eye
taste / olfactory
otic / lateral line
epidermis
periderm
fin
ionocytes / mucous
pigment cells
Expression by stage/cluster
Correlated gene expression
Positive correlation
Negative correlation
Gene
r
Gene
r
crp1
0.153
krt4
-0.047
pcdh2ab2
0.147
cyt1
-0.043
zgc:195356
0.137
romo1
-0.040
BX649490.4
0.130
actb2
-0.039
zgc:85843
0.108
krt17
-0.037
LOC101884081
0.105
ndufaf2
-0.034
si:ch73-242m19.1
0.103
cyt1l
-0.033
LOC110437915
0.099
krtt1c19e
-0.033
tulp1b
0.096
anxa2a
-0.032
muc13a
0.094
rhbg
-0.032
LOC110438072
0.094
krt5
-0.031
ankrd52b
0.092
wu:fa03e10
-0.031
si:dkey-56i24.1
0.089
ppdpfb
-0.028
si:dkey-9l20.3
0.088
pycard
-0.027
hsp90b1
0.085
rhcgl1
-0.027
calr3b
0.085
gsta.1
-0.026
XLOC-010131
0.084
tubb4b
-0.026
pdia3
0.083
nop53
-0.026
si:dkey-239b22.2
0.082
XLOC-011066
-0.025
hnf4a
0.082
fxyd6l
-0.025
fkbp11
0.081
s100v2
-0.025
calr3a
0.081
aldob
-0.025
AL953894.1
0.080
fuca1.1
-0.025
hspa5
0.080
zgc:111983
-0.025
tent5ba
0.078
CU914622.2
-0.024
LOC108183778
0.077
pfn1
-0.023
c3a.5
0.075
rps15a
-0.023
znf1046
0.075
tspo
-0.023
cyp2x9
0.071
tdh
-0.023
hyou1
0.070
mapre1a
-0.023
CU550713.1
0.069
si:ch211-157c3.4
-0.023
CABZ01053748.1
0.068
eevs
-0.022
rrbp1a
0.068
rhcga
-0.022
galr1b
0.068
faua
-0.022
gdf6b
0.068
si:ch211-207n23.2
-0.022