Daniocell
hpse2 (otic / lateral line)
heparanase 2
ZFIN
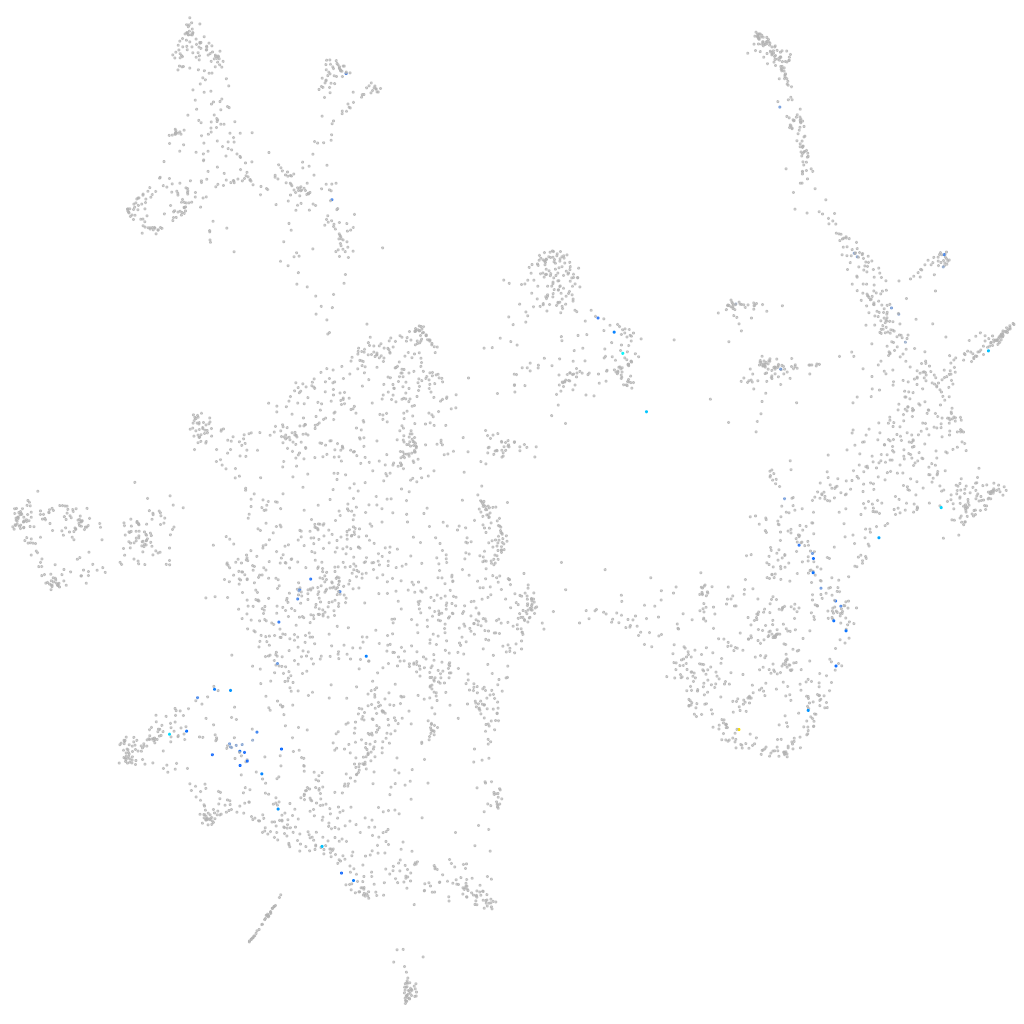
Gene expression UMAP
Display:
Expression
Stage
Other cell groups
all cells
blastomeres
PGCs
endoderm
axial mesoderm
muscle
mural cells /
non-skeletal muscle
mesenchyme
hematopoietic /
vasculature
pronephros
neural
spinal cord / glia
eye
taste / olfactory
otic / lateral line
epidermis
periderm
fin
ionocytes / mucous
pigment cells
Expression by stage/cluster
Correlated gene expression
Positive correlation
Negative correlation
Gene
r
Gene
r
CABZ01051977.1
0.317
pax2a
-0.053
si:ch211-152f22.4
0.305
acbd7
-0.045
CU019647.1
0.271
cycsb
-0.044
si:rp71-7l19.2
0.260
sfrp5
-0.039
hdac7b
0.256
OTOP1
-0.038
lctlb
0.224
nr2f1a
-0.037
LOC103909515
0.222
six1a
-0.037
LOC103910489
0.218
slc3a2b
-0.037
LOC110437994
0.214
pkdcca
-0.036
CU182107.1
0.212
sall3b
-0.036
XLOC-020459
0.208
si:ch211-133n4.6
-0.036
mlsl
0.202
si:ch211-80h18.1
-0.035
hoxb9a
0.196
uqcrq
-0.035
si:dkeyp-30e7.2
0.193
ca4a
-0.035
BX649266.1
0.191
nr2f2
-0.035
slc5a9
0.190
ubap2a
-0.035
si:ch211-250e5.2
0.178
si:ch211-152c2.3
-0.035
CR925761.1
0.178
zgc:194210
-0.035
zgc:172131
0.177
ptprz1b
-0.033
sult3st2
0.172
stc2a
-0.033
znf541
0.169
s100s
-0.033
opn1lw1
0.164
psph
-0.032
CU984600.2
0.162
lmx1bb
-0.032
si:ch211-214p13.8
0.161
carhsp1
-0.032
smyd1b
0.159
otomp
-0.032
LOC110438935
0.153
aldocb
-0.031
foxc1a
0.152
si:ch211-235e9.6
-0.031
hoxb8a
0.145
kif1aa
-0.031
kcnk17
0.142
mdh2
-0.031
col6a4a
0.141
eno1a
-0.031
eps8l3b
0.140
pbx4
-0.031
mfap4
0.139
CR751602.2
-0.031
gys2
0.137
si:dkey-151g10.3
-0.030
LOC108179656
0.136
si:ch211-263k4.2
-0.030
LOC101883235
0.135
tom1l2b
-0.030