Daniocell
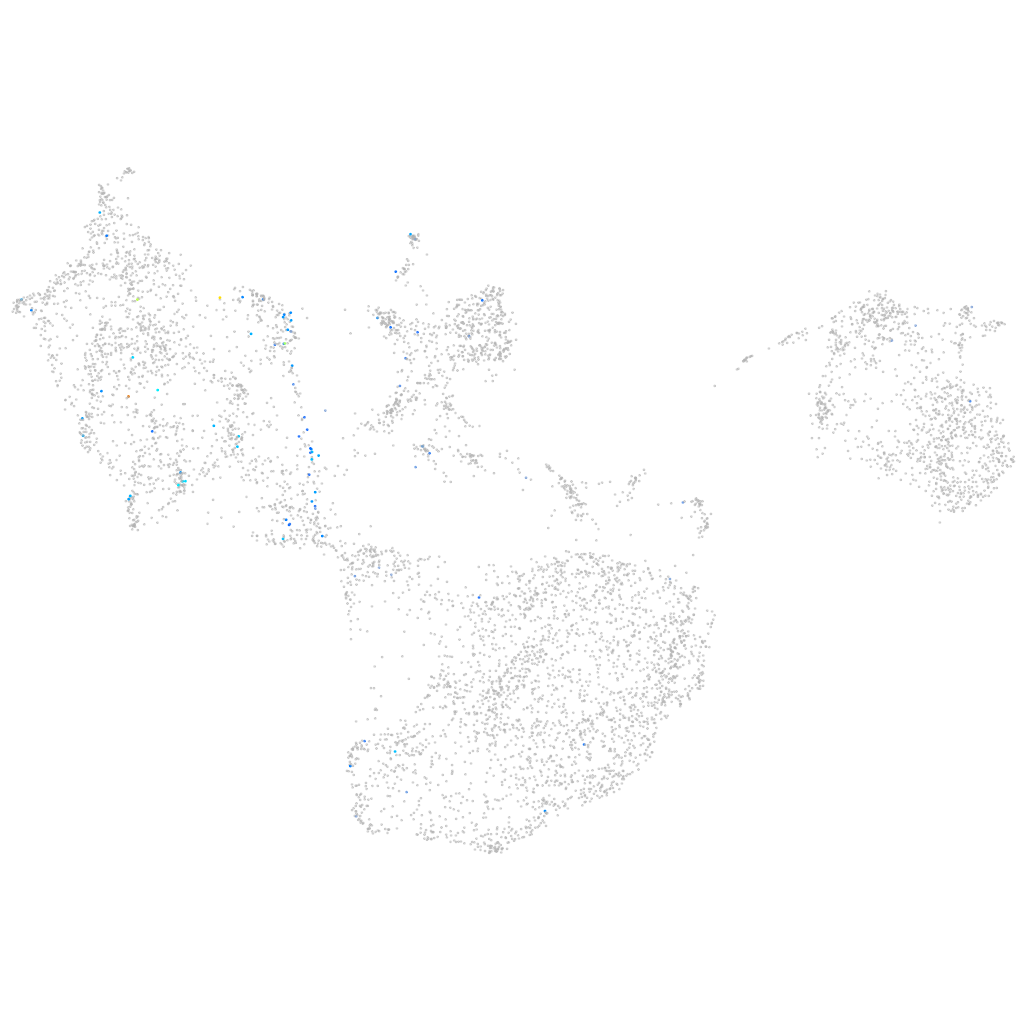
hpse2 (fin)
heparanase 2
ZFIN
Gene expression UMAP
Display:
Expression
Stage
Other cell groups
all cells
blastomeres
PGCs
endoderm
axial mesoderm
muscle
mural cells /
non-skeletal muscle
mesenchyme
hematopoietic /
vasculature
pronephros
neural
spinal cord / glia
eye
taste / olfactory
otic / lateral line
epidermis
periderm
fin
ionocytes / mucous
pigment cells
Expression by stage/cluster
Correlated gene expression
Positive correlation
Negative correlation
Gene
r
Gene
r
tbx15
0.174
tmsb1
-0.103
LOC103910736
0.163
cfl1l
-0.098
XLOC-024206
0.162
pfn1
-0.098
fgfbp2a
0.155
cldni
-0.094
mef2ca
0.153
cotl1
-0.094
csf1b
0.152
s100a10b
-0.094
ctsll
0.144
cyt1
-0.093
BX247870.2
0.140
epcam
-0.091
si:ch211-162i8.2
0.140
cldn1
-0.091
grn2
0.133
tmsb4x
-0.089
vegfd
0.132
anxa1a
-0.088
BX088596.2
0.131
krt4
-0.088
abcc12
0.123
rbp4
-0.083
tbx18
0.122
pycard
-0.083
znf1023
0.120
si:dkey-248g15.3
-0.082
CABZ01072563.1
0.120
myh9a
-0.082
CR847844.1
0.120
cap1
-0.081
valopb
0.117
thy1
-0.080
si:dkeyp-59c12.1
0.116
wu:fb18f06
-0.079
zmp:0000001048
0.116
spaca4l
-0.079
si:dkey-188i13.10
0.115
si:dkey-102c8.3
-0.079
pmp22a
0.115
icn
-0.078
grem1b
0.115
ecrg4b
-0.077
P2RY14
0.114
apoeb
-0.077
tbx5a
0.113
capns1a
-0.076
XLOC-014093
0.113
krt5
-0.076
hoxa13b
0.112
tagln2
-0.075
fgf10a
0.112
zgc:153284
-0.075
eif4enif1
0.111
bcam
-0.075
XLOC-040350
0.110
plecb
-0.074
LOC110438048
0.109
capgb
-0.074
angptl2a
0.109
itgb1b.1
-0.074
LO018205.1
0.108
zgc:86896
-0.072
crispld1b
0.107
arhgdig
-0.072
si:dkey-27i16.2
0.107
ahnak
-0.072