Daniocell
hpse2 (ionocytes / mucous-producing)
heparanase 2
ZFIN
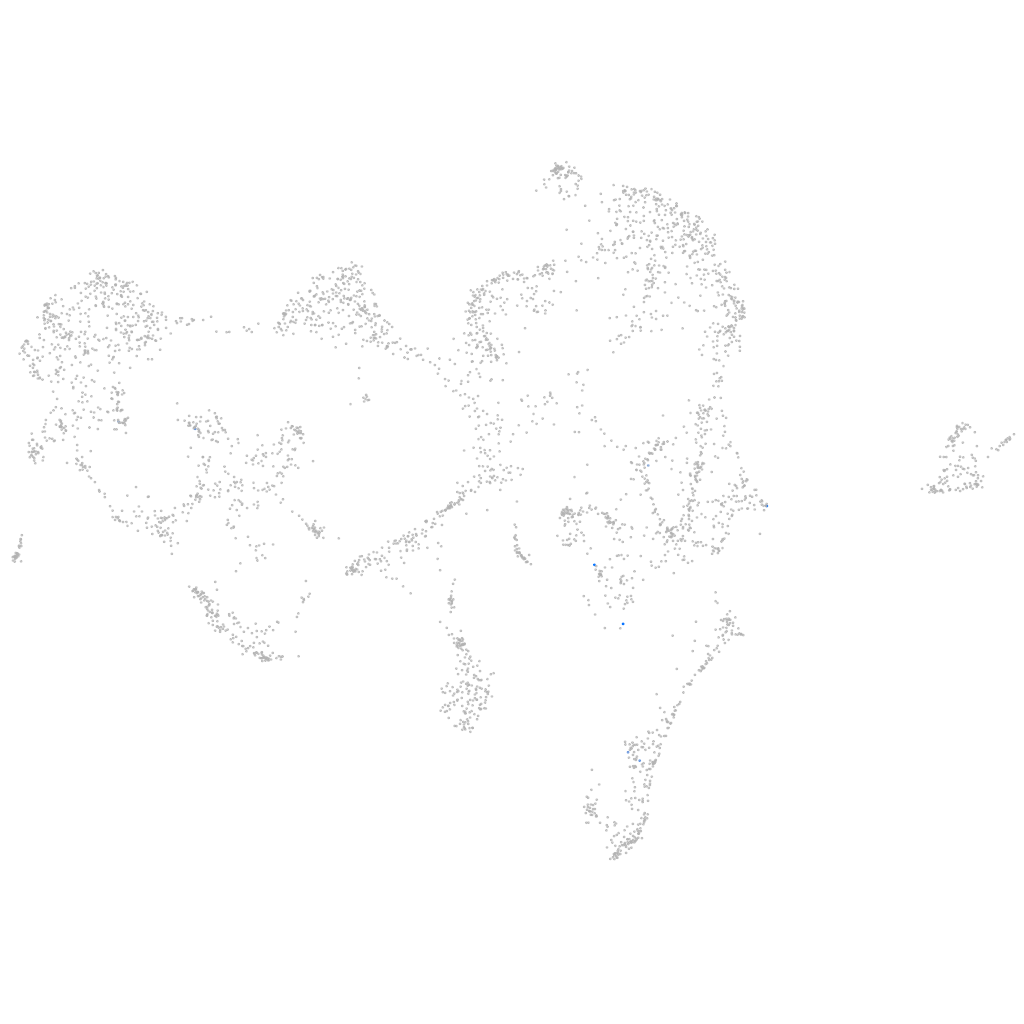
Gene expression UMAP
Display:
Expression
Stage
Other cell groups
all cells
blastomeres
PGCs
endoderm
axial mesoderm
muscle
mural cells /
non-skeletal muscle
mesenchyme
hematopoietic /
vasculature
pronephros
neural
spinal cord / glia
eye
taste / olfactory
otic / lateral line
epidermis
periderm
fin
ionocytes / mucous
pigment cells
Expression by stage/cluster
Correlated gene expression
Positive correlation
Negative correlation
Gene
r
Gene
r
zgc:136605
0.500
romo1
-0.039
XLOC-036509
0.498
ndufa2
-0.034
CT574585.1
0.468
zgc:110333
-0.032
LOC100006401
0.396
XLOC-043857
-0.030
dip2bb
0.394
cs
-0.030
BX005329.2
0.394
si:ch211-195b11.3
-0.030
LOC108187081
0.386
ppifb
-0.029
wnt7ba
0.370
ndufa3
-0.029
LOC103908672
0.339
ISCU (1 of many)
-0.029
LOC100536646
0.337
cmc1
-0.029
slc6a3
0.304
cox8a
-0.028
si:ch211-202p1.5
0.297
atp6v0b
-0.028
olfcd3
0.283
LOC799574
-0.028
zmp:0000000650
0.281
atp5pf
-0.028
or132-5
0.281
BX000438.2
-0.028
XLOC-017021
0.277
cox7c
-0.027
si:ch1073-80i24.3
0.277
gb:bc139872
-0.027
LOC110437891
0.273
timm17a
-0.027
BX324207.1
0.270
si:dkey-33i11.4
-0.027
trarg1b
0.264
mcl1b
-0.027
prdm13
0.262
ndufa6
-0.027
BX324006.2
0.260
h1fx
-0.026
BX640522.2
0.259
gabarapl2
-0.026
LOC101883622
0.252
cst14b.1
-0.026
chrng
0.251
acadm
-0.026
BX548062.1
0.246
tspan36
-0.026
si:ch211-122l14.7
0.243
dlst
-0.026
LOC108192079
0.238
atp5if1b
-0.026
foxb2
0.236
FQ323156.1
-0.025
zp2.5
0.226
minos1
-0.025
sowahca
0.219
si:dkey-247k7.2
-0.025
mamdc2b
0.217
ca2
-0.025
cldn10b
0.216
cox6c
-0.025
CR391953.1
0.212
pvalb1
-0.025
pm20d1.1
0.211
tdh
-0.024