Daniocell
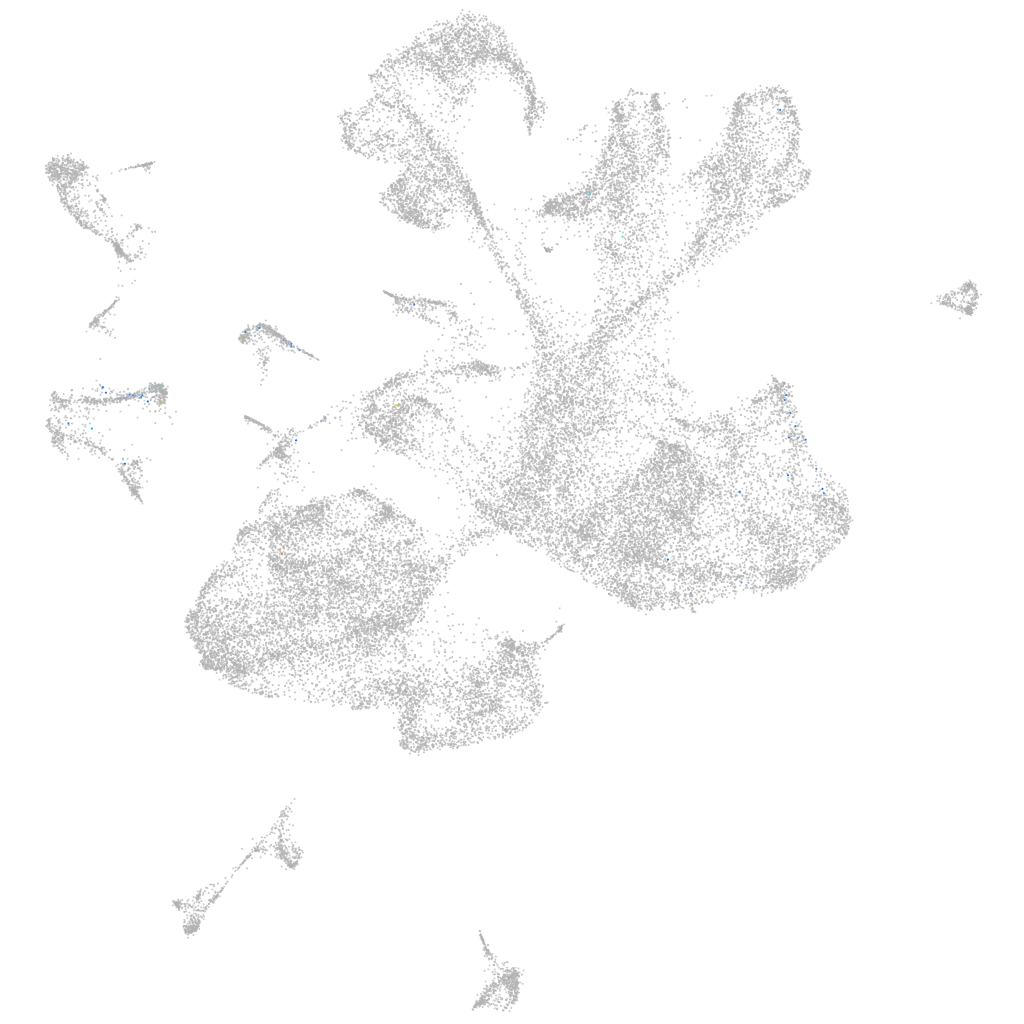
hpse2 (glial cells / spinal cord)
heparanase 2
ZFIN
Gene expression UMAP
Display:
Expression
Stage
Other cell groups
all cells
blastomeres
PGCs
endoderm
axial mesoderm
muscle
mural cells /
non-skeletal muscle
mesenchyme
hematopoietic /
vasculature
pronephros
neural
spinal cord / glia
eye
taste / olfactory
otic / lateral line
epidermis
periderm
fin
ionocytes / mucous
pigment cells
Expression by stage/cluster
Correlated gene expression
Positive correlation
Negative correlation
Gene
r
Gene
r
slc5a12
0.248
fabp3
-0.021
crybb2
0.183
ptmab
-0.020
zmp:0000000545
0.177
rtn1a
-0.020
trim110
0.161
marcksb
-0.018
CABZ01024844.1
0.148
si:ch211-137a8.4
-0.018
BX000460.1
0.142
elavl3
-0.018
tmed6
0.137
hmgn6
-0.017
gpx2
0.131
cirbpa
-0.017
CU861459.1
0.120
baz2ba
-0.017
XLOC-038717
0.111
hmgb1b
-0.017
LOC110438215
0.098
CU467822.1
-0.017
CR936408.2
0.097
tmsb4x
-0.017
LOC108183749
0.096
si:ch73-21g5.7
-0.016
LOC110438075
0.090
nucks1a
-0.016
crispld1b
0.088
sinhcafl
-0.016
c6ast1
0.087
dla
-0.016
BX324142.2
0.086
nova2
-0.016
LOC100333474
0.084
pou3f3b
-0.016
slco1f3
0.083
XLOC-003689
-0.016
hsd3b1
0.081
snrpd1
-0.015
nfatc1
0.081
apex1
-0.015
CU179758.1
0.078
lrrn1
-0.015
npr3
0.078
myt1a
-0.015
f2
0.074
si:ch73-30b17.2
-0.014
arhgef19
0.072
hmgb3b
-0.014
LOC110438422
0.070
tmeff1b
-0.014
CU693379.1
0.070
gadd45gb.1
-0.014
zgc:174904
0.069
g3bp1
-0.014
BX088603.1
0.067
LOC798783
-0.014
si:ch211-76m11.8
0.066
ptmaa
-0.014
thbs1b
0.066
ier5
-0.014
ctgfa
0.065
cox7a2a
-0.014
LOC100006752
0.065
pfn2l
-0.014
c1qtnf12
0.065
tp53inp2
-0.014
tnfaip8l1
0.065
smarce1
-0.014