Daniocell
extl3 (hematopoietic / vasculature)
exostosin-like glycosyltransferase 3
ZFIN
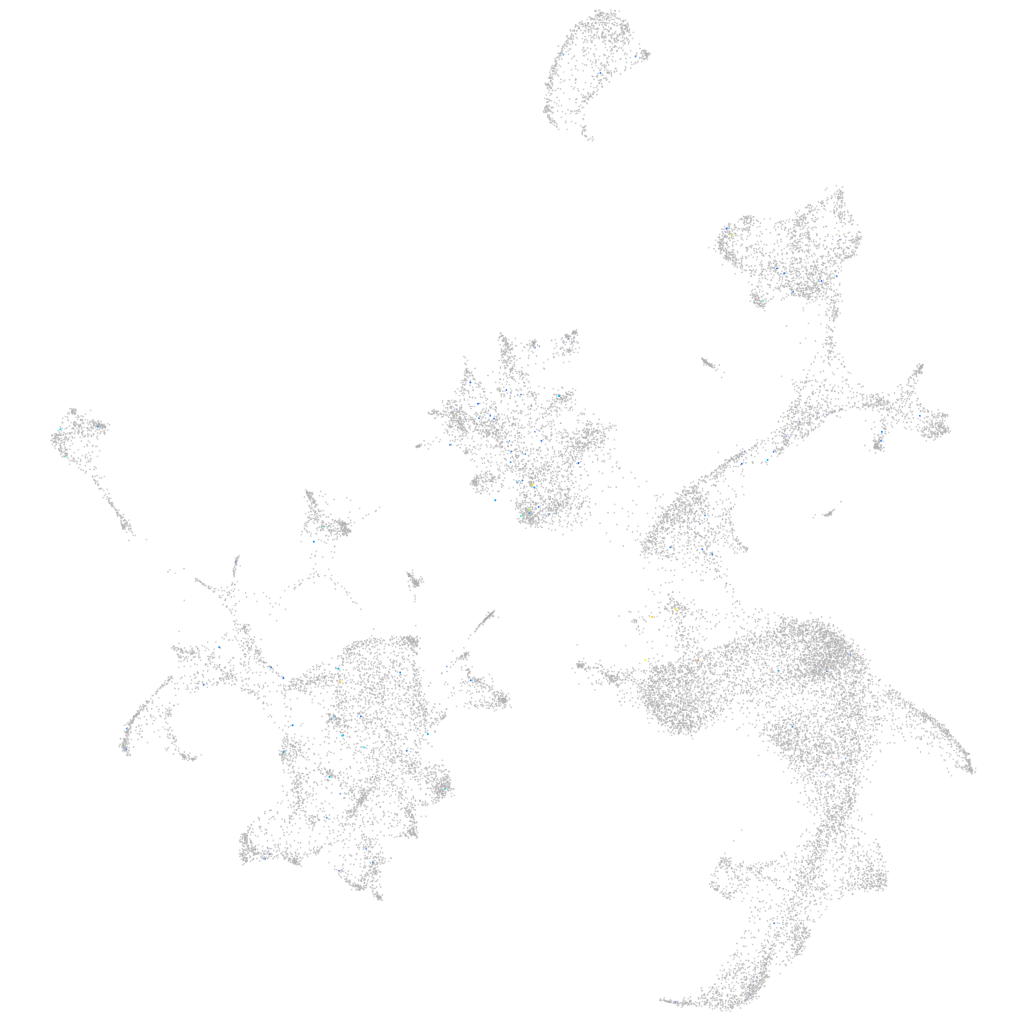
Gene expression UMAP
Display:
Expression
Stage
Other cell groups
all cells
blastomeres
PGCs
endoderm
axial mesoderm
muscle
mural cells /
non-skeletal muscle
mesenchyme
hematopoietic /
vasculature
pronephros
neural
spinal cord / glia
eye
taste / olfactory
otic / lateral line
epidermis
periderm
fin
ionocytes / mucous
pigment cells
Expression by stage/cluster
Correlated gene expression
Positive correlation
Negative correlation
Gene
r
Gene
r
si:dkey-47k20.2
0.219
prdx2
-0.023
XLOC-040494
0.176
nmt1b
-0.020
si:ch211-133l5.4
0.167
hbbe1.1
-0.020
XLOC-020175
0.167
zgc:163057
-0.019
trim54
0.163
fth1a
-0.019
btg4
0.161
blvrb
-0.018
CR749777.1
0.139
hemgn
-0.017
XLOC-003136
0.133
bloc1s6
-0.016
agmat
0.113
si:dkey-100n23.3
-0.015
AL935044.1
0.110
hbae3
-0.015
mep1a.2
0.104
tmod4
-0.015
ptchd1
0.104
CR293511.1
-0.015
sgip1b
0.103
hbbe3
-0.015
XLOC-010379
0.101
mibp2
-0.015
kcnk13b
0.093
hbbe1.3
-0.015
c1ql2
0.093
hbae1.1
-0.014
galr1a
0.093
ucp3
-0.014
lrrc7
0.092
ctrb1
-0.014
kif21a
0.091
hbae1.3
-0.014
LOC110437849
0.089
rhd
-0.014
XLOC-023752
0.087
alas2
-0.013
cmya5
0.086
plac8l1
-0.013
si:dkey-14o6.1
0.084
hbae5
-0.013
ak5
0.084
slc10a4
-0.013
slc30a10
0.083
cahz
-0.013
CT025585.1
0.083
alad
-0.013
si:ch211-121a2.4
0.082
hbbe2
-0.012
LOC110437922
0.082
zgc:194981
-0.012
BX511023.1
0.081
tspo
-0.012
PTPRD
0.080
rfesd
-0.012
cbln17
0.080
pvalb2
-0.012
si:ch73-305o9.3
0.079
hbbe1.2
-0.012
zgc:112492
0.079
stx2b
-0.012
CT027609.1
0.079
si:dkeyp-120h9.1
-0.012
kctd16a
0.079
pabpc1b
-0.011