Daniocell
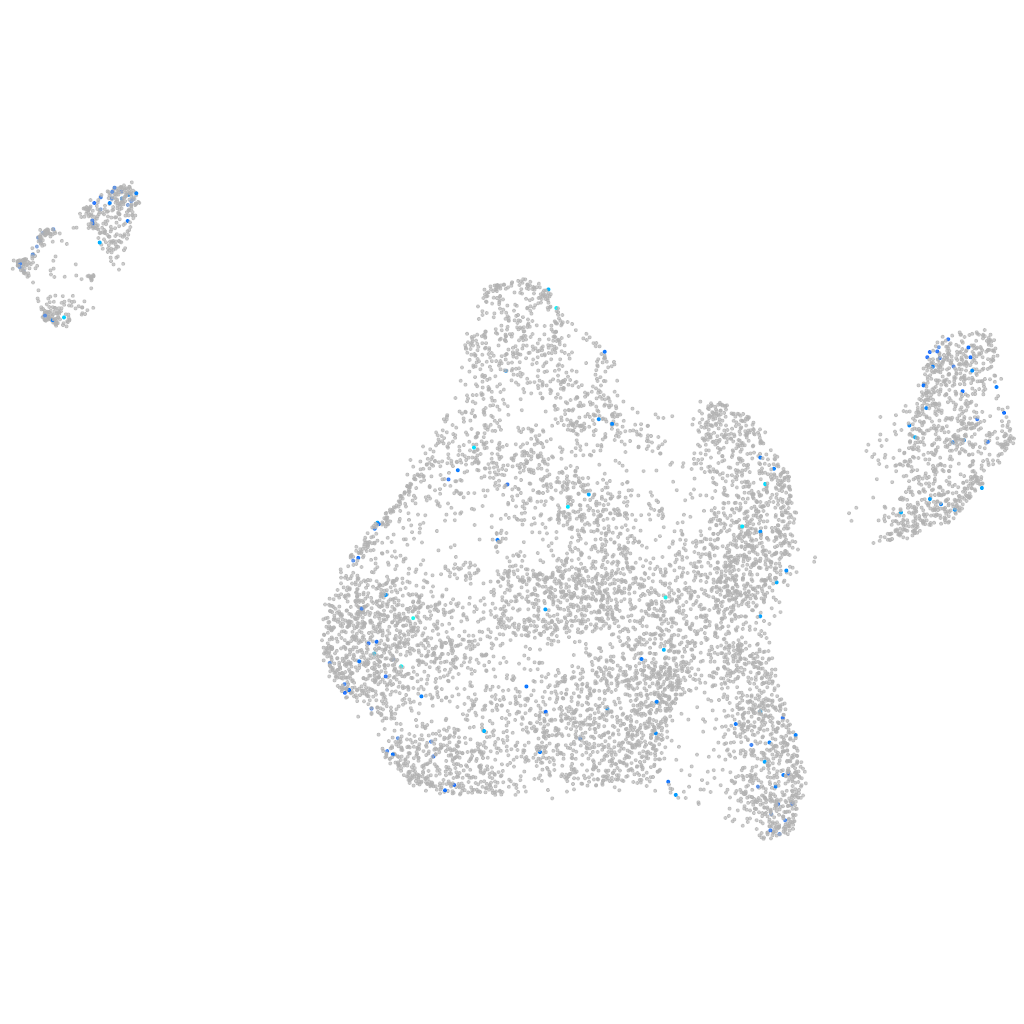
extl3 (blastomeres)
exostosin-like glycosyltransferase 3
ZFIN
Gene expression UMAP
Display:
Expression
Stage
Other cell groups
all cells
blastomeres
PGCs
endoderm
axial mesoderm
muscle
mural cells /
non-skeletal muscle
mesenchyme
hematopoietic /
vasculature
pronephros
neural
spinal cord / glia
eye
taste / olfactory
otic / lateral line
epidermis
periderm
fin
ionocytes / mucous
pigment cells
Expression by stage/cluster
Correlated gene expression
Positive correlation
Negative correlation
Gene
r
Gene
r
LOC108181454
0.170
hspb1
-0.063
CR855311.4
0.166
ptmab
-0.058
atp10b
0.160
si:ch211-222l21.1
-0.057
cpa2
0.142
eef1a1l1
-0.054
XLOC-025051
0.140
si:ch73-1a9.3
-0.054
LOC795083
0.129
si:ch211-152c2.3
-0.052
si:ch211-232d10.3
0.125
hmgn2
-0.051
LO018605.2
0.119
hnrnpa0b
-0.050
kcnb1
0.116
rpl10a
-0.049
svopb
0.112
rps12
-0.048
tdo2b
0.111
hmgb2a
-0.048
si:ch73-113g13.2
0.107
aldob
-0.047
BX601646.1
0.106
marcksl1b
-0.046
rec8a
0.106
si:dkey-151g10.6
-0.046
LOC100537963
0.105
dynll1
-0.045
alk
0.103
rpl11
-0.045
si:dkey-188g12.1
0.103
hmga1a
-0.045
arhgef38
0.099
rplp0
-0.045
nkx2.4b
0.099
rplp1
-0.045
tpo
0.098
anp32e
-0.045
flrt1b
0.098
si:dkey-56m19.5
-0.044
hs6st3a
0.096
polr3gla
-0.044
BX323797.4
0.095
rps20
-0.043
afap1l2
0.095
NC-002333.4
-0.043
carmil1
0.094
rpl39
-0.041
LOC110440098
0.093
rpl36
-0.040
si:dkey-85k7.11
0.093
rps15
-0.040
si:dkey-174i8.1
0.093
rpl10
-0.040
LOC559637
0.092
add3b
-0.040
fam20cb
0.091
gnl3
-0.039
zgc:172270
0.090
rps5
-0.039
nitr1m
0.088
rpl36a
-0.039
adora1b
0.087
stm
-0.039
LOC101884113
0.087
rpsa
-0.039
ftr16
0.087
hmgb2b
-0.038