Daniocell
extl3 (neural)
exostosin-like glycosyltransferase 3
ZFIN
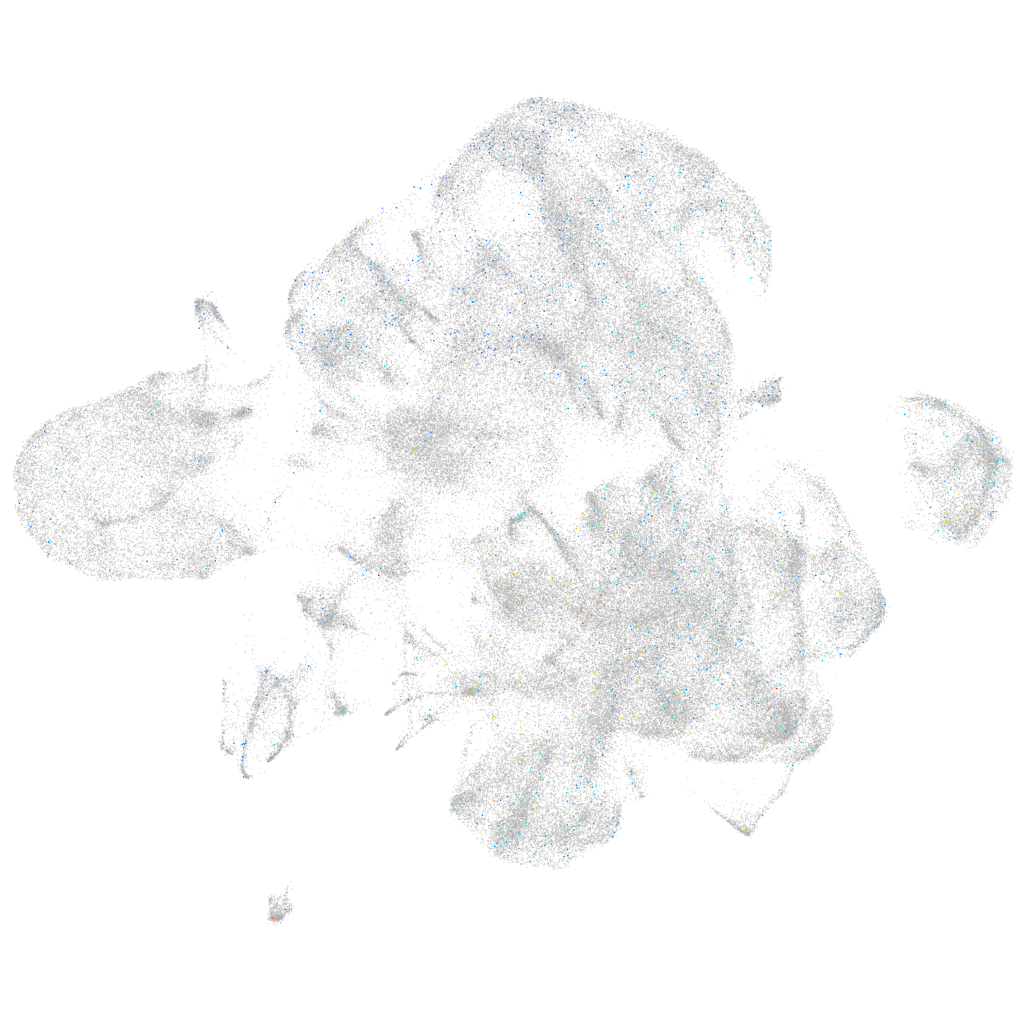
Gene expression UMAP
Display:
Expression
Stage
Other cell groups
all cells
blastomeres
PGCs
endoderm
axial mesoderm
muscle
mural cells /
non-skeletal muscle
mesenchyme
hematopoietic /
vasculature
pronephros
neural
spinal cord / glia
eye
taste / olfactory
otic / lateral line
epidermis
periderm
fin
ionocytes / mucous
pigment cells
Expression by stage/cluster
Correlated gene expression
Positive correlation
Negative correlation
Gene
r
Gene
r
LOC101883916
0.047
si:dkey-151g10.6
-0.024
si:dkey-53k12.2
0.039
hmgb2b
-0.023
spi1a
0.038
hmgb2a
-0.022
LOC101884743
0.038
npm1a
-0.022
caiap
0.038
rps20
-0.020
LOC110437924.1
0.038
dkc1
-0.020
bco2b
0.037
rpl30
-0.020
LOC101886581
0.036
rplp1
-0.020
BX276107.1
0.035
ranbp1
-0.020
XLOC-042220
0.035
rpl36
-0.020
XLOC-015260
0.032
fbl
-0.020
LOC101884169
0.032
rps7
-0.020
zgc:109913
0.031
rpl36a
-0.020
plcxd2
0.030
rpl6
-0.019
si:ch211-66k16.2
0.029
rps29
-0.019
LOC100333218
0.029
eef1a1l1
-0.019
atp6v0cb
0.029
rps3a
-0.019
LOC101886601.1
0.029
nop10
-0.019
rnasekb
0.029
rsl1d1
-0.019
cpz
0.028
ebna1bp2
-0.019
LOC110437781
0.028
nop58
-0.019
LOC103911808
0.028
rps12
-0.019
LOC101885649
0.028
si:ch211-152c2.3
-0.019
CR383676.1
0.027
rpl39
-0.019
cpe
0.027
stm
-0.019
mt-atp6
0.027
snrpf
-0.019
nrxn1a
0.027
cbx3a
-0.019
sncb
0.026
h2afvb
-0.019
wdr95
0.026
nop56
-0.018
zmp:0000000606
0.026
tma7
-0.018
CU469568.3
0.026
rpl10a
-0.018
atpv0e2
0.026
rpl11
-0.018
xkr7
0.026
gar1
-0.018
CABZ01059392.1
0.026
anp32b
-0.018
LOC103911812
0.026
ddx18
-0.018