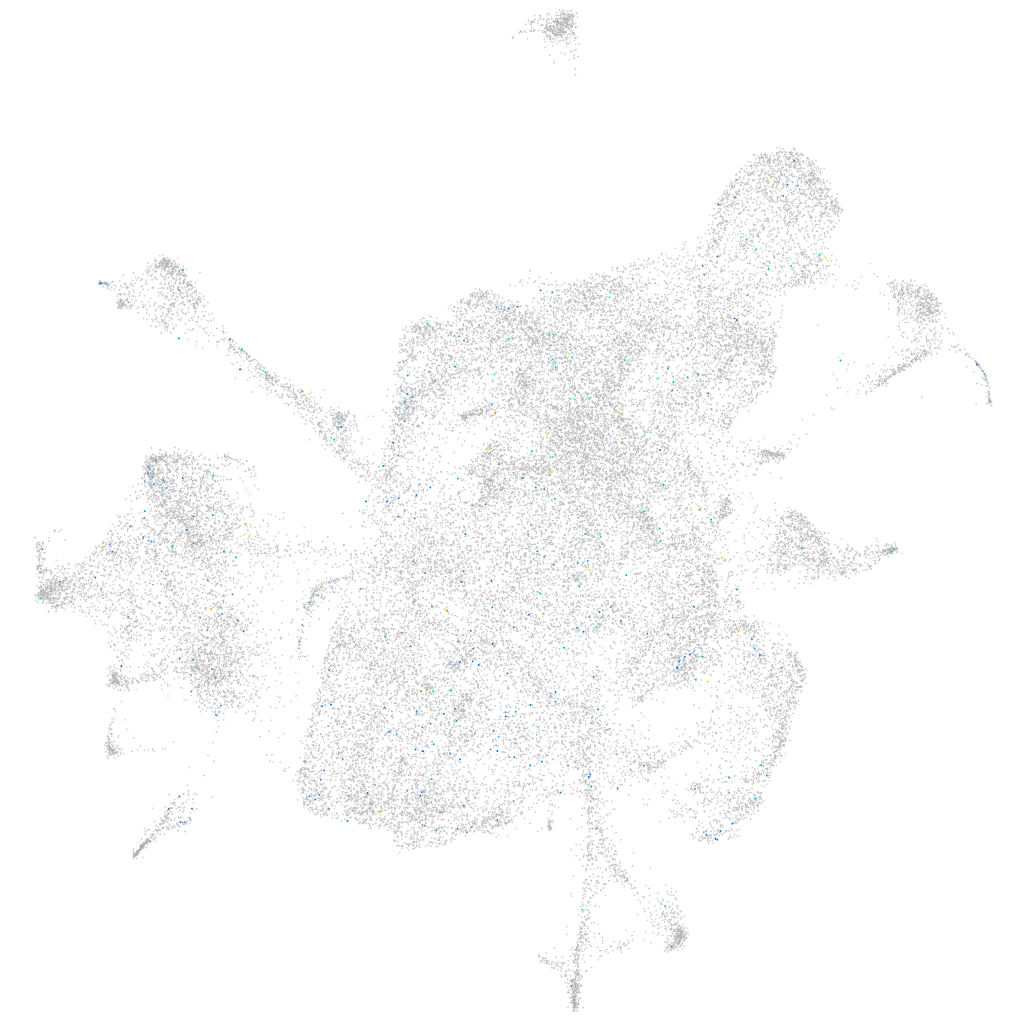
Daniocell
extl3 (mesenchyme)
exostosin-like glycosyltransferase 3
ZFIN
Gene expression UMAP
Display:
Expression
Stage
Other cell groups
all cells
blastomeres
PGCs
endoderm
axial mesoderm
muscle
mural cells /
non-skeletal muscle
mesenchyme
hematopoietic /
vasculature
pronephros
neural
spinal cord / glia
eye
taste / olfactory
otic / lateral line
epidermis
periderm
fin
ionocytes / mucous
pigment cells
Expression by stage/cluster
Correlated gene expression
Positive correlation
Negative correlation
Gene
r
Gene
r
g6pcb
0.093
aldob
-0.015
BX324119.1
0.084
rps5
-0.014
LOC108182421
0.080
tmem176l.1
-0.014
FP015862.4
0.078
CR848683.2
-0.013
BX470229.2
0.074
rbp4
-0.013
ephx4
0.066
col11a1a
-0.013
LOC101886911
0.065
zgc:153704
-0.013
LOC101883563
0.063
si:dkey-183i3.5
-0.013
CABZ01088484.1
0.061
zgc:163098
-0.013
kcnj1a.1
0.060
ela2l
-0.012
XLOC-014488
0.060
marveld2a
-0.012
LOC100149247
0.057
ptgdsb.1
-0.012
si:dkey-42l23.5
0.057
XLOC-044191
-0.012
si:ch73-252p3.1
0.056
fgfbp2b
-0.012
LOC101884619
0.056
crispld1b
-0.012
LOC108190667
0.055
prss59.2
-0.012
ptk6b
0.054
mmp2
-0.012
LOC101882492
0.052
XLOC-023492
-0.012
LOC100537401
0.051
epyc
-0.011
LOC110438278
0.051
eef1da
-0.011
ccdc17
0.050
rho
-0.011
LOC101885301
0.050
herpud2
-0.011
BX004768.1
0.050
opn1lw2
-0.011
socs1b
0.049
ak2
-0.011
LOC110438215
0.049
VIT
-0.011
CU694952.1
0.048
tfa
-0.011
FO704822.1
0.048
ppap2d
-0.011
XLOC-020556
0.047
ift46
-0.011
CABZ01084564.1
0.047
eif4ebp3
-0.011
si:ch73-233f7.8
0.044
prss1
-0.011
nitr1k
0.044
rps26l
-0.011
tnni4b.1
0.043
zgc:63882
-0.010
si:dkey-4c15.16
0.043
SYDE2
-0.010
LOC799914
0.043
tob1b
-0.010
si:dkey-61p9.9
0.042
klf15
-0.010