Daniocell
extl3 (pigment cells)
exostosin-like glycosyltransferase 3
ZFIN
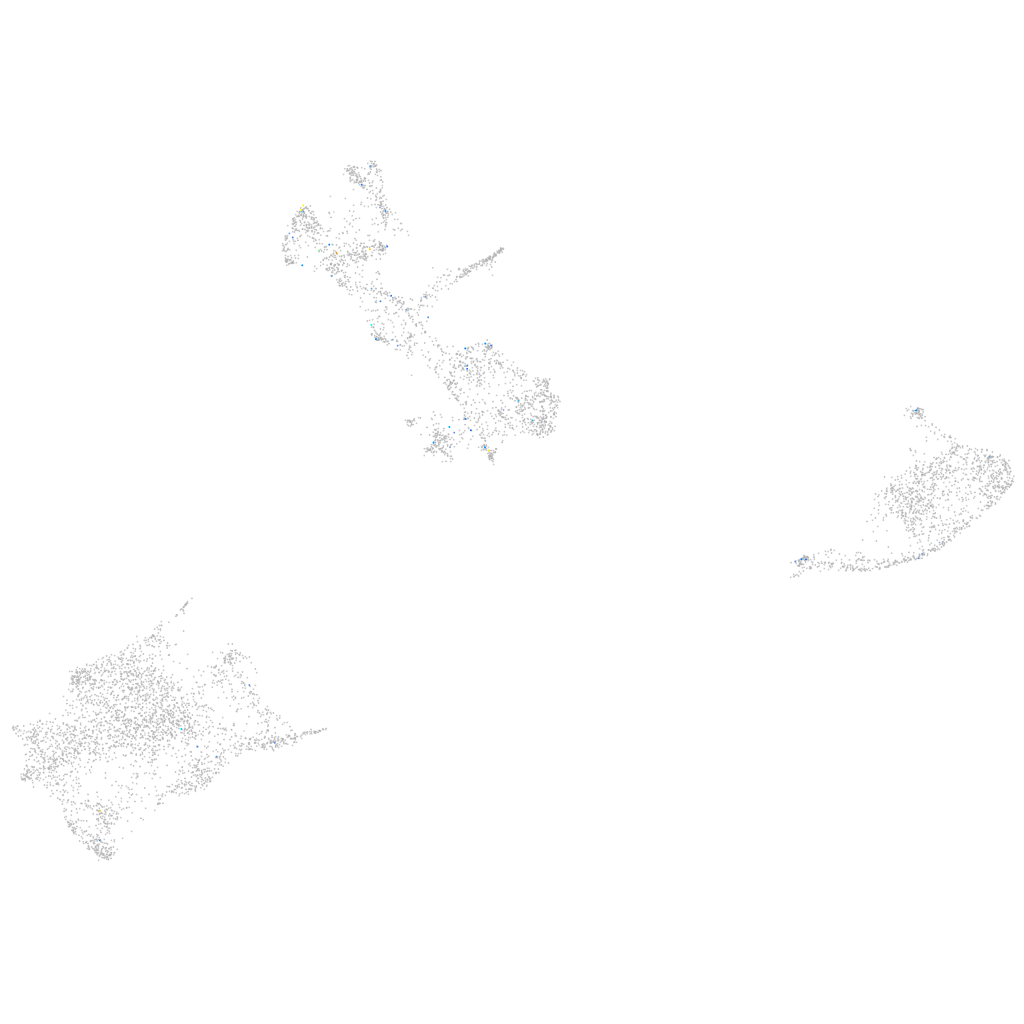
Gene expression UMAP
Display:
Expression
Stage
Other cell groups
all cells
blastomeres
PGCs
endoderm
axial mesoderm
muscle
mural cells /
non-skeletal muscle
mesenchyme
hematopoietic /
vasculature
pronephros
neural
spinal cord / glia
eye
taste / olfactory
otic / lateral line
epidermis
periderm
fin
ionocytes / mucous
pigment cells
Expression by stage/cluster
Correlated gene expression
Positive correlation
Negative correlation
Gene
r
Gene
r
vtcn1
0.274
gch2
-0.067
zmp:0000000845
0.271
gstp1
-0.064
CR405715.1
0.270
CABZ01021592.1
-0.053
BX571828.1
0.255
akr1b1
-0.050
XLOC-034199
0.247
pts
-0.048
ccr10
0.244
slc22a7a
-0.046
FO905027.1
0.242
si:dkey-251i10.2
-0.045
FO905052.1
0.239
zgc:110339
-0.043
LOC100149223
0.232
hbae1.1
-0.039
rom1a
0.225
actb2
-0.038
LOC101886505
0.221
rab34b
-0.036
znf831
0.217
cd63
-0.036
XLOC-029870
0.212
tmem130
-0.035
LOC100333185
0.203
rtn1b
-0.035
si:ch1073-268j14.1
0.200
pcbd1
-0.035
zmp:0000000906
0.199
s100a10b
-0.034
LOC101886601.1
0.175
C12orf75
-0.034
tmem64
0.170
marcksl1b
-0.034
hist1h2ba
0.169
uraha
-0.033
LOC100535070
0.167
cyb5a
-0.033
CCKAR
0.164
icn
-0.033
tgfbr2a
0.164
prdx1
-0.033
adamts13
0.157
bco1
-0.033
kdrl
0.153
gpd1b
-0.032
LOC110439576
0.152
slc2a11b
-0.031
si:ch73-106g13.1
0.148
pik3c3
-0.031
serpina7
0.148
cotl1
-0.031
scmh1
0.145
gstt1a
-0.030
zgc:195001
0.142
csrp2
-0.029
irbpl
0.142
bscl2l
-0.028
XLOC-032577
0.141
aox5
-0.028
XLOC-038035
0.139
si:zfos-1069f5.1
-0.027
LOC110437966
0.139
hbbe1.3
-0.027
si:dkey-6n21.13
0.139
tdh
-0.027
LOC100150095
0.138
zgc:91968
-0.026