Daniocell
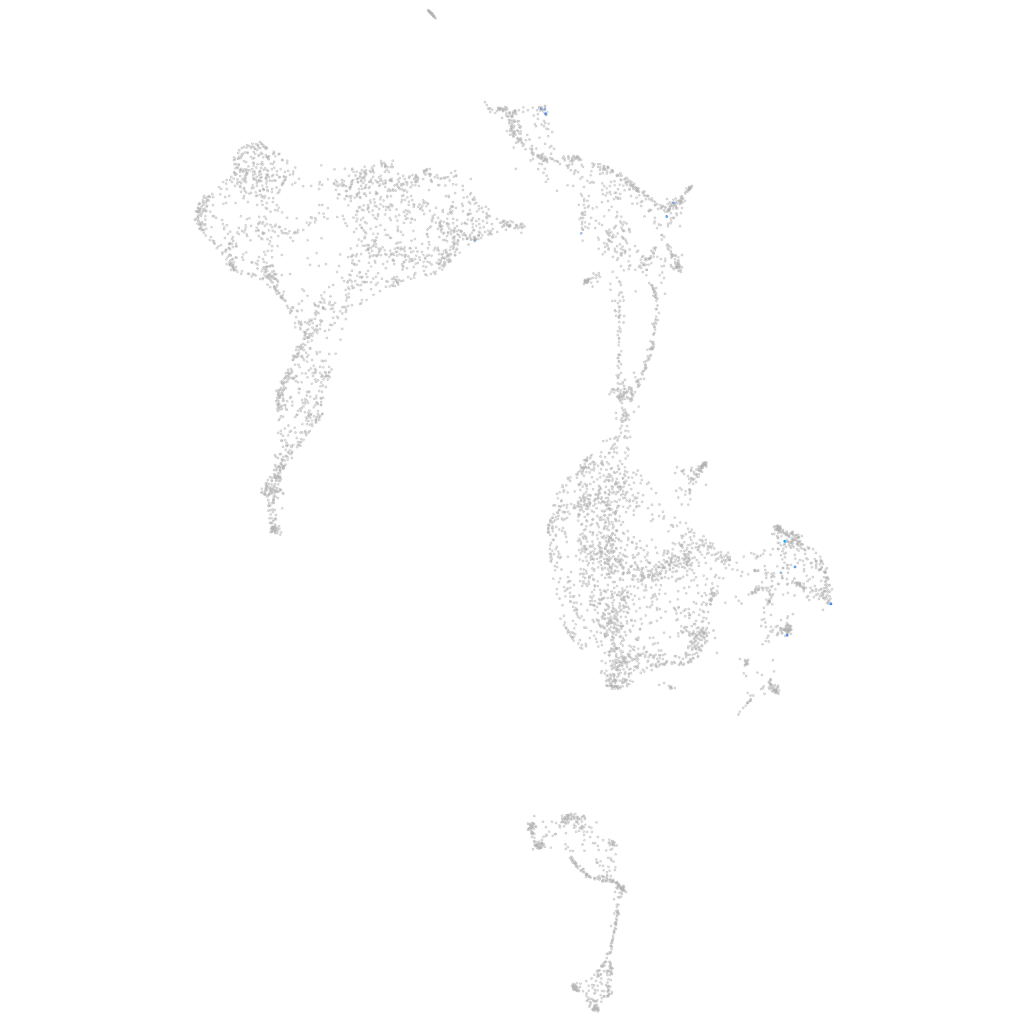
BX469902.1 (axial mesoderm)
Gene expression UMAP
Display:
Expression
Stage
Other cell groups
all cells
blastomeres
PGCs
endoderm
axial mesoderm
muscle
mural cells /
non-skeletal muscle
mesenchyme
hematopoietic /
vasculature
pronephros
neural
spinal cord / glia
eye
taste / olfactory
otic / lateral line
epidermis
periderm
fin
ionocytes / mucous
pigment cells
Expression by stage/cluster
Correlated gene expression
Positive correlation
Negative correlation
Gene
r
Gene
r
LOC103908636
0.555
si:ch211-217k17.7
-0.031
fam155b
0.410
atp1b1a
-0.029
ttll3
0.405
cdk2ap2
-0.028
grid1b
0.399
snu13b
-0.026
LOC553308
0.368
gnl3
-0.025
si:ch211-262i1.3
0.365
khdrbs1b
-0.025
dclk2b
0.347
si:ch211-152c2.3
-0.024
CABZ01050280.1
0.321
krt18a.1
-0.024
gipr
0.314
ptp4a2b
-0.023
mafb
0.305
si:dkey-16p21.8
-0.023
KCNJ15
0.302
elavl1a
-0.023
arf4b
0.291
mt-nd5
-0.022
BX323586.3
0.281
rbm6
-0.022
LOC110438604
0.269
epcam
-0.022
soga3b
0.268
rbm39a
-0.022
BX323994.2
0.252
ddit4
-0.022
CU914144.1
0.232
f11r.1
-0.022
gdf10b
0.228
ndufa11
-0.022
svopa
0.228
pdap1a
-0.022
LOC108191529
0.215
nap1l4a
-0.022
si:ch211-220f12.4
0.211
aldob
-0.022
wnt3
0.208
tbx16
-0.022
si:dkey-183i3.9
0.207
sf1
-0.022
zic4
0.203
wdr46
-0.021
BX571794.2
0.198
nsrp1
-0.021
gpr61
0.196
zmp:0000000624
-0.021
wnt10b
0.193
stk35l
-0.021
LOC101882857
0.193
usp10
-0.021
glipr1b
0.193
atp1b3b
-0.021
rgs7bpa
0.192
stm
-0.021
esrrga
0.191
usp36
-0.021
apbb3
0.191
ahcyl2
-0.021
si:ch211-241b2.4
0.186
ddx23
-0.021
birc7
0.185
safb
-0.020
CABZ01085594.1
0.181
mob3a
-0.020