Daniocell
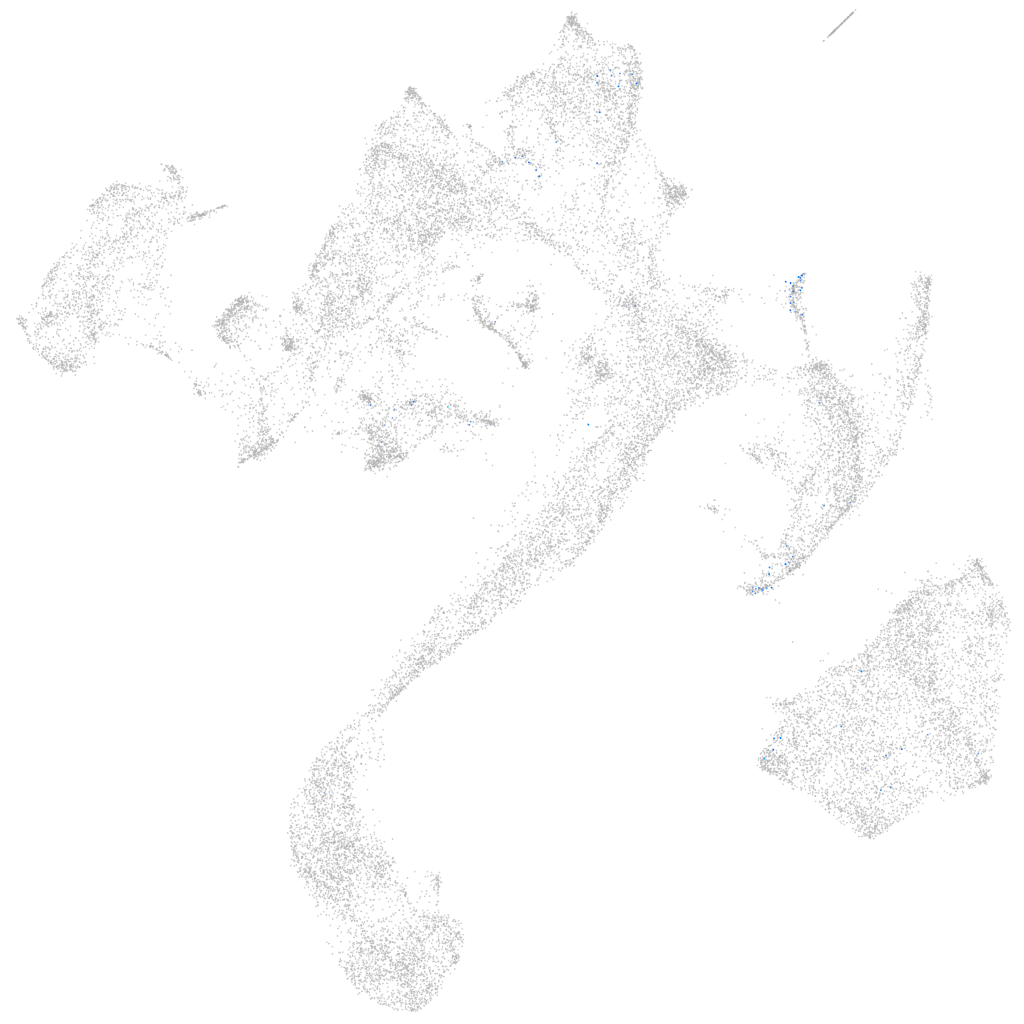
BX469902.1 (muscle)
Gene expression UMAP
Display:
Expression
Stage
Other cell groups
all cells
blastomeres
PGCs
endoderm
axial mesoderm
muscle
mural cells /
non-skeletal muscle
mesenchyme
hematopoietic /
vasculature
pronephros
neural
spinal cord / glia
eye
taste / olfactory
otic / lateral line
epidermis
periderm
fin
ionocytes / mucous
pigment cells
Expression by stage/cluster
Correlated gene expression
Positive correlation
Negative correlation
Gene
r
Gene
r
LOC100001713
0.149
ttn.1
-0.037
LOC101883177
0.142
ttn.2
-0.034
zic5
0.128
hsp90aa1.1
-0.033
BX927210.1
0.121
actc1b
-0.032
LOC101884469
0.116
pabpc4
-0.032
hoxa13a
0.114
ak1
-0.031
LOC101883163
0.109
tmem38a
-0.031
BX005399.3
0.108
gatm
-0.030
CABZ01074203.1
0.103
desma
-0.030
lgals3bpa
0.100
acta1a
-0.030
hoxa13b
0.099
gamt
-0.030
LOC101887111
0.097
aldoab
-0.030
hoxc13a
0.096
klhl41b
-0.029
hoxc13b
0.094
actc1a
-0.029
si:dkey-9p24.5
0.091
nexn
-0.029
hoxb13a
0.091
ldb3a
-0.029
BX511261.1
0.089
zgc:92429
-0.029
LOC103908978.1
0.089
ckma
-0.028
si:dkey-45h7.1
0.088
mdh2
-0.028
XLOC-016803
0.087
tpi1b
-0.028
si:dkey-58b18.8
0.087
gapdh
-0.028
FO704721.1
0.086
fxr2
-0.028
her15.1
0.085
CABZ01078594.1
-0.028
XLOC-003690
0.081
srl
-0.028
hoxd12a
0.081
cav3
-0.028
CU207301.2
0.080
mybphb
-0.028
msx2b
0.080
atp2a1
-0.028
msx1b
0.079
rbfox1l
-0.027
CR854988.1
0.079
zgc:92518
-0.027
gdf11
0.079
tpma
-0.027
AL845362.1
0.078
chchd10
-0.027
slc6a1l
0.076
ckmb
-0.027
LOC110438440
0.074
acta1b
-0.027
CU639468.1
0.073
zgc:101853
-0.026
XLOC-004335
0.073
ldb3b
-0.026