Daniocell
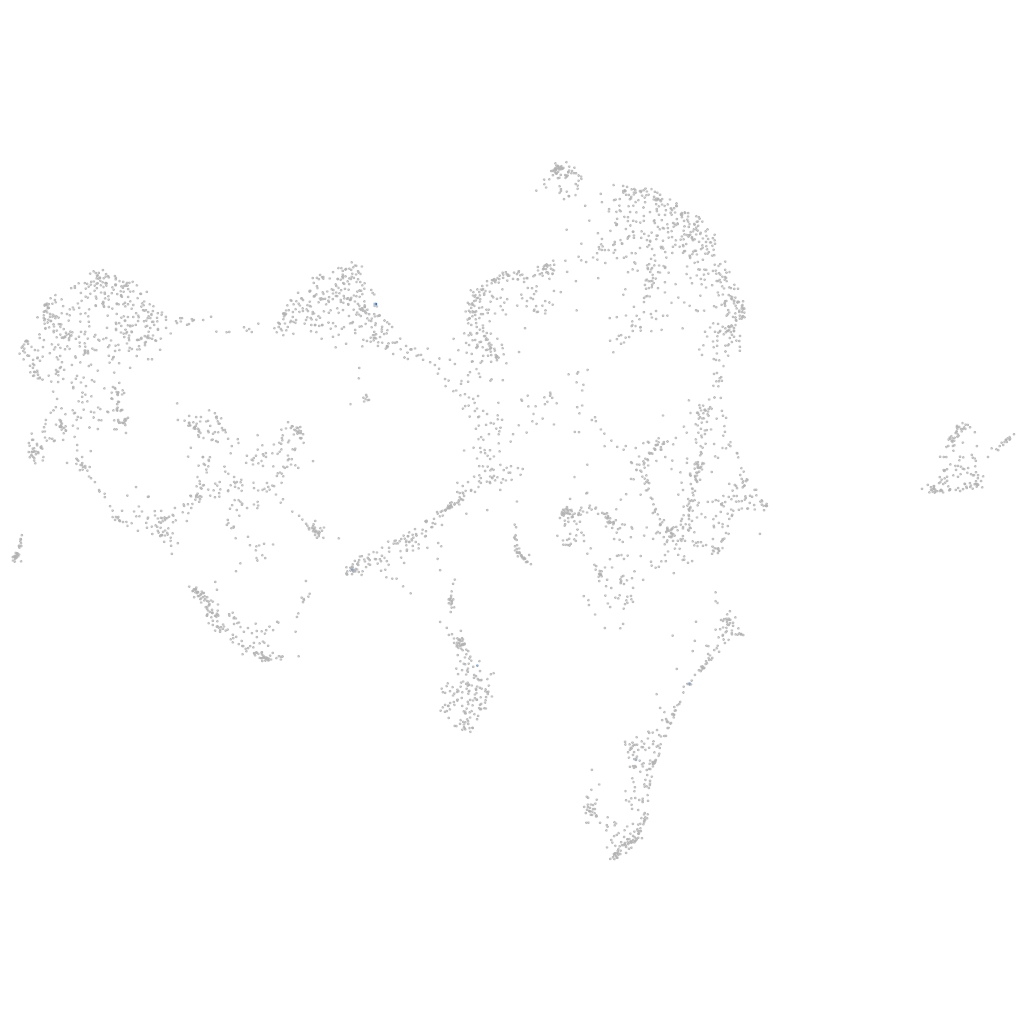
BX469902.1 (ionocytes / mucous-producing)
Gene expression UMAP
Display:
Expression
Stage
Other cell groups
all cells
blastomeres
PGCs
endoderm
axial mesoderm
muscle
mural cells /
non-skeletal muscle
mesenchyme
hematopoietic /
vasculature
pronephros
neural
spinal cord / glia
eye
taste / olfactory
otic / lateral line
epidermis
periderm
fin
ionocytes / mucous
pigment cells
Expression by stage/cluster
Correlated gene expression
Positive correlation
Negative correlation
Gene
r
Gene
r
LOC103910383
0.546
zgc:158463
-0.039
itk
0.456
krt91
-0.028
si:dkeyp-110c12.3
0.447
nop53
-0.025
LOC110438837
0.413
krt5
-0.025
loxhd1b
0.351
anp32a
-0.024
si:ch73-139e5.4
0.348
ppm1aa
-0.024
BX255963.2
0.312
them6
-0.024
vtna
0.306
znf185
-0.023
dnah12
0.288
si:dkey-28b4.7
-0.023
LOC100330706
0.285
pabpn1
-0.023
CU855821.1
0.285
FQ323156.1
-0.022
asb14b
0.277
ip6k2a
-0.022
gabra5
0.275
rps27l
-0.022
CABZ01081777.1
0.254
rplp2
-0.022
si:ch211-196c10.13
0.234
prrg2
-0.022
BX649490.3
0.222
nsa2
-0.022
cbln18
0.222
sptlc2b
-0.022
XLOC-042909
0.220
ckap4
-0.022
cyp2p9
0.202
evpla
-0.021
LOC100537702
0.200
slc25a20
-0.021
fat1b
0.198
ccng2
-0.021
zgc:77748
0.180
capn2b
-0.021
gra
0.180
hrc
-0.021
dre-let-7i
0.178
ndufaf2
-0.021
si:dkey-4p15.5
0.177
smim4
-0.021
tpcn3
0.176
cops7a
-0.021
fndc7b
0.173
tcima
-0.021
LOC110437755
0.172
zgc:56304
-0.020
LOC101886742
0.165
aldh3b1
-0.020
foxc1a
0.164
klhl24b
-0.020
slc16a7
0.160
rpl36
-0.020
gsx2
0.160
s100w
-0.020
pcdh1g29
0.158
med19a
-0.020
CABZ01041495.1
0.157
ifrd1
-0.020
acap2
0.154
aldob
-0.020