Daniocell
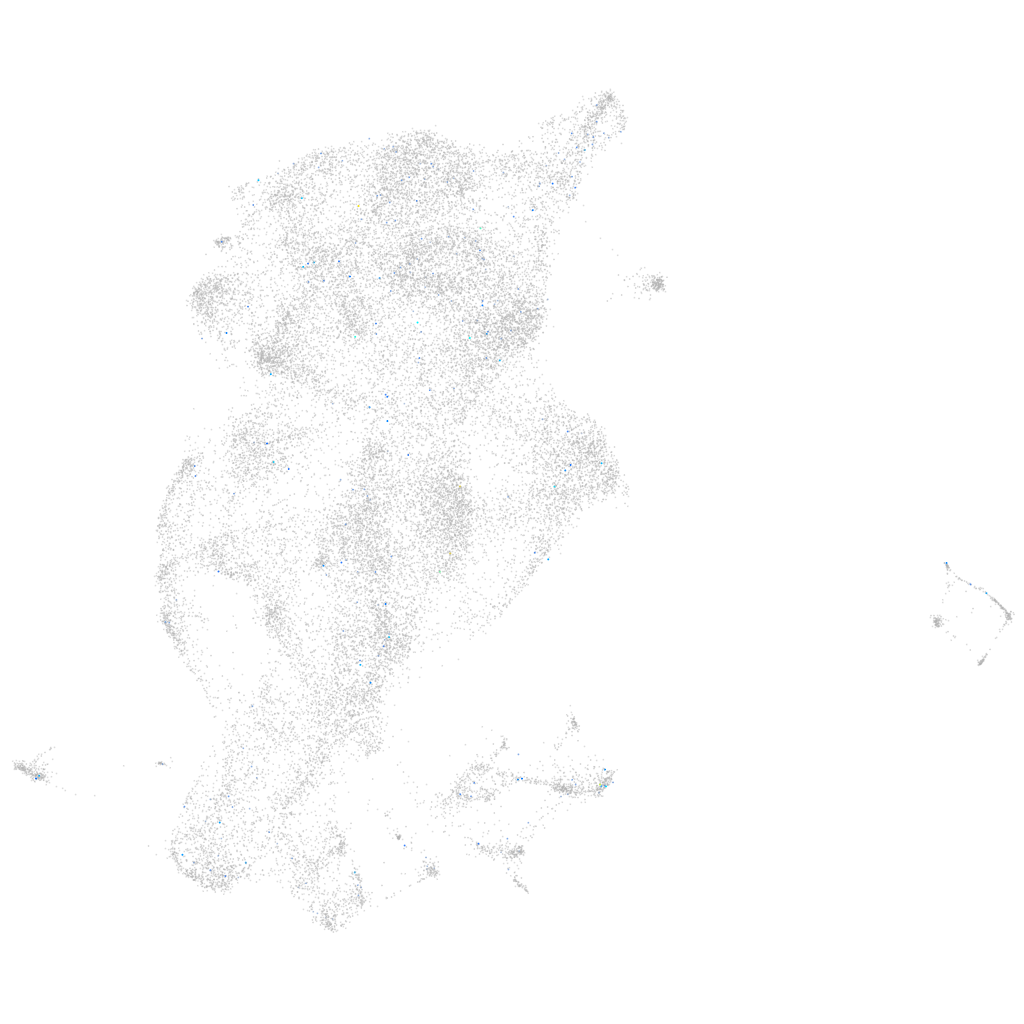
adarb1b (periderm)
adenosine deaminase RNA specific B1b
ZFIN
Gene expression UMAP
Display:
Expression
Stage
Other cell groups
all cells
blastomeres
PGCs
endoderm
axial mesoderm
muscle
mural cells /
non-skeletal muscle
mesenchyme
hematopoietic /
vasculature
pronephros
neural
spinal cord / glia
eye
taste / olfactory
otic / lateral line
epidermis
periderm
fin
ionocytes / mucous
pigment cells
Expression by stage/cluster
Correlated gene expression
Positive correlation
Negative correlation
Gene
r
Gene
r
RYR2
0.205
aep1
-0.020
lrrtm4l2
0.186
sec61g
-0.020
grin2cb
0.180
icn2
-0.019
LOC103910381
0.157
krt4
-0.019
LOC100332354
0.147
icn
-0.016
cadm2b
0.147
nccrp1
-0.015
acanb
0.142
tmsb1
-0.015
cbln12
0.133
arhgef12a
-0.015
BX571762.2
0.130
cyt1l
-0.014
wu:fj39g12
0.126
rpl12
-0.014
golga7bb
0.122
gstp1
-0.013
pkn1b
0.119
smco4
-0.013
LOC110439302
0.115
txndc5
-0.013
ccl34a.4
0.114
lias
-0.013
fgf20a
0.113
cyt1
-0.013
tagln3a
0.111
anxa1c
-0.013
si:ch211-137i24.12
0.106
gsta.1
-0.013
si:dkey-219c10.4
0.104
rpl39
-0.013
LOC101882959
0.104
wu:fb18f06
-0.013
si:ch73-379j16.2
0.102
ndufaf2
-0.012
zgc:92275
0.098
cfl1l
-0.012
kiaa1549lb
0.098
pmm2
-0.012
znf1050
0.093
si:dkey-184p9.7
-0.012
CABZ01081294.1
0.091
s100v2
-0.012
gsg1l
0.091
aco2
-0.012
LOC103909845
0.090
tmem168a
-0.012
BX005256.1
0.090
ak2
-0.012
LOC100149007
0.089
cox6b2
-0.011
si:ch211-173n18.3
0.089
pck2
-0.011
entpd5a
0.087
prr13
-0.011
slc8a2b
0.086
gsto2
-0.011
XLOC-038703
0.085
stk26
-0.011
tmem125
0.085
rpl31
-0.011
si:dkey-216e24.3
0.084
vhl
-0.011
XLOC-002422
0.084
si:ch211-161h7.8
-0.011