Daniocell
adarb1b (epidermis)
adenosine deaminase RNA specific B1b
ZFIN
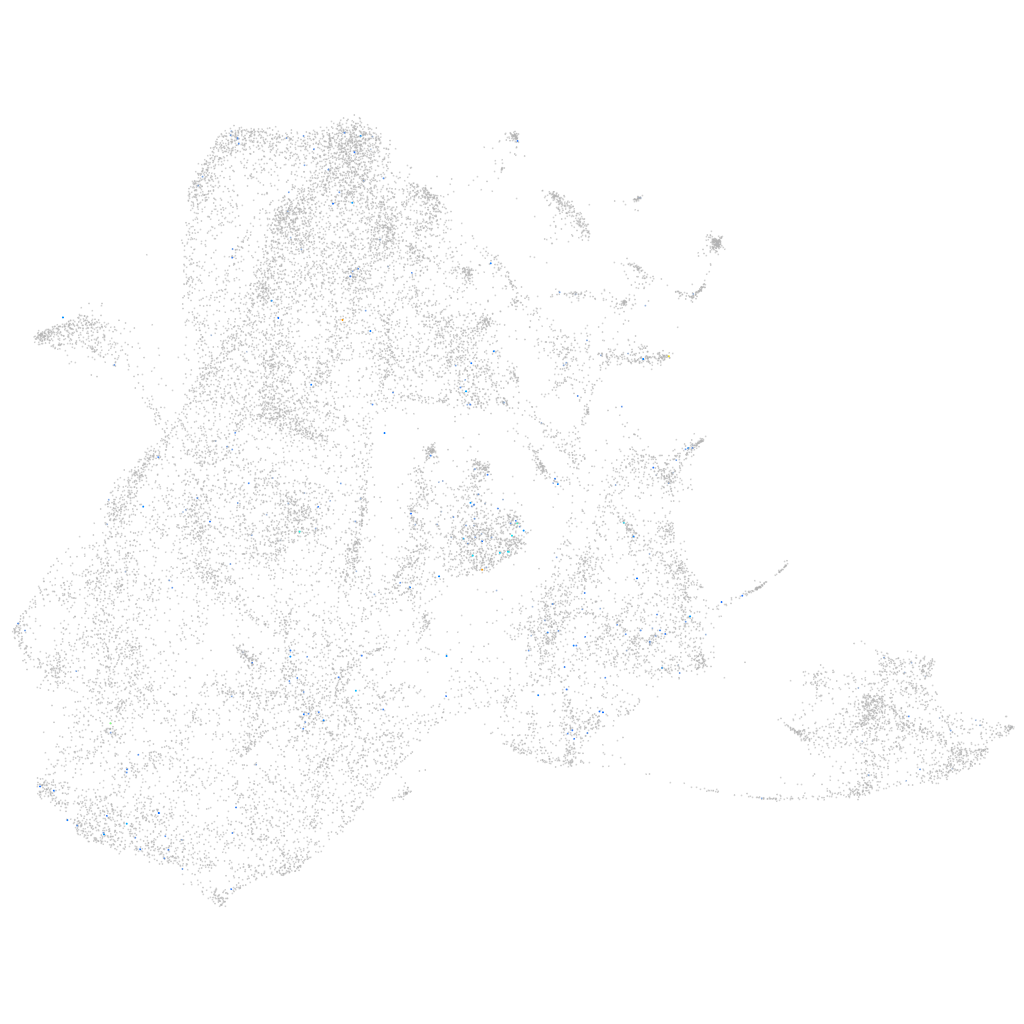
Gene expression UMAP
Display:
Expression
Stage
Other cell groups
all cells
blastomeres
PGCs
endoderm
axial mesoderm
muscle
mural cells /
non-skeletal muscle
mesenchyme
hematopoietic /
vasculature
pronephros
neural
spinal cord / glia
eye
taste / olfactory
otic / lateral line
epidermis
periderm
fin
ionocytes / mucous
pigment cells
Expression by stage/cluster
Correlated gene expression
Positive correlation
Negative correlation
Gene
r
Gene
r
leg1.2
0.223
cyt1
-0.048
CU651657.1
0.182
cfl1l
-0.044
LOC100536910
0.154
krt4
-0.043
si:dkey-151g22.1
0.153
pfn1
-0.040
adgrg7.1
0.153
actb2
-0.039
LOC108184071
0.146
tmsb1
-0.038
fndc7b
0.142
s100a10b
-0.037
LOC108187081
0.140
pleca
-0.036
LOC101883584
0.139
rps24
-0.035
LOC103908739
0.133
actb1
-0.033
klhl23
0.128
cldn1
-0.032
si:dkey-27m7.4
0.123
ecrg4b
-0.031
tmem163a
0.121
cyt1l
-0.031
pcdh1g14
0.119
myl12.1
-0.030
xkr5a
0.118
rpl29
-0.029
LOC560461
0.117
zgc:101810
-0.029
emp1
0.113
spaca4l
-0.029
ntrk2b
0.110
thy1
-0.029
CR936300.1
0.109
si:ch211-166a6.5
-0.029
si:ch211-151m7.6
0.109
cotl1
-0.029
si:ch1073-140o9.2
0.108
si:dkey-16p21.8
-0.029
camk1a
0.107
cavin2a
-0.028
mttp
0.106
rpl38
-0.028
si:dkey-21e2.15
0.105
hcls1
-0.028
clint1b
0.104
gsnb
-0.027
sult4a1
0.104
postnb
-0.027
BX957317.2
0.101
zgc:175088
-0.027
nostrin
0.101
zgc:153284
-0.027
CU929073.1
0.099
anxa1a
-0.026
CU462914.1
0.099
dnase1l4.1
-0.026
kcns3a
0.098
arpc2
-0.026
grm6a
0.098
krt8
-0.025
FQ311924.2
0.097
col2a1b
-0.025
zgc:77938
0.097
capns1a
-0.025
tppp2
0.096
col1a2
-0.025