Daniocell
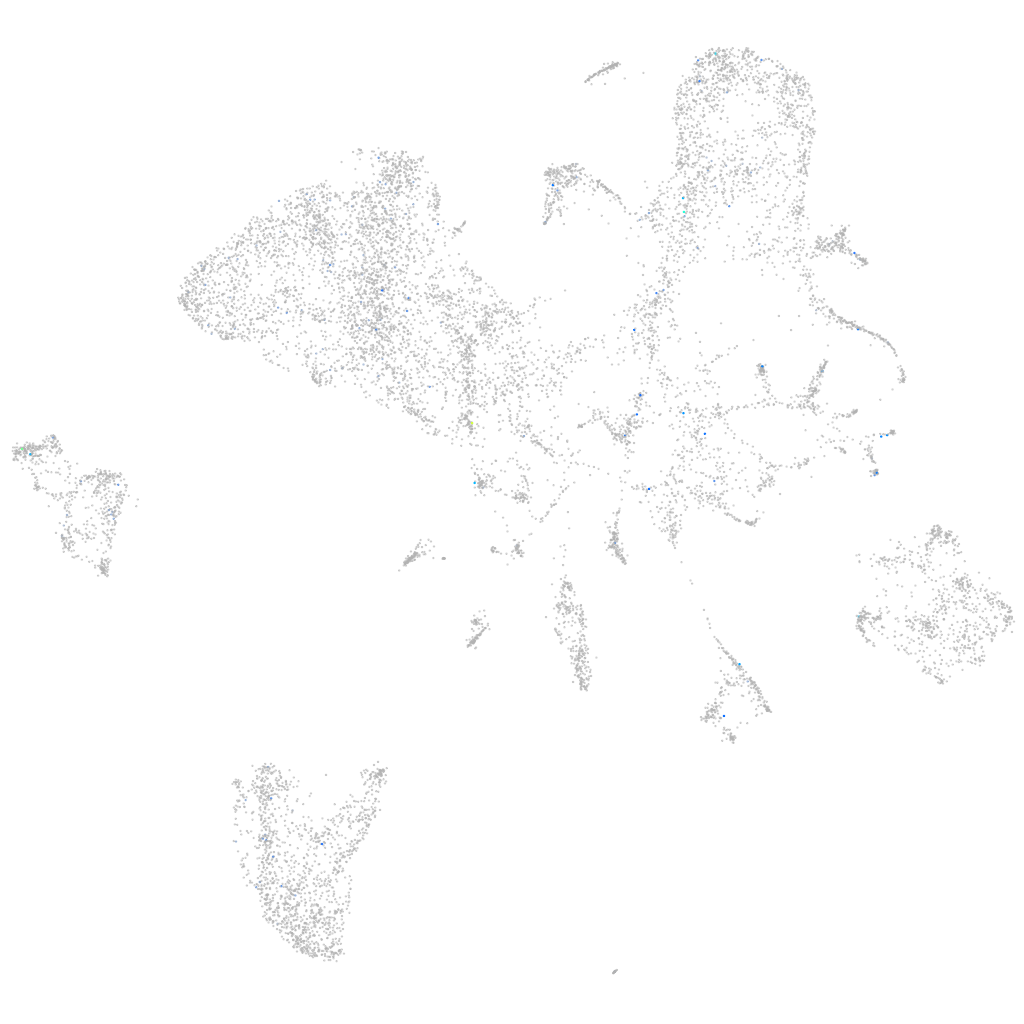
adarb1b (endoderm)
adenosine deaminase RNA specific B1b
ZFIN
Gene expression UMAP
Display:
Expression
Stage
Other cell groups
all cells
blastomeres
PGCs
endoderm
axial mesoderm
muscle
mural cells /
non-skeletal muscle
mesenchyme
hematopoietic /
vasculature
pronephros
neural
spinal cord / glia
eye
taste / olfactory
otic / lateral line
epidermis
periderm
fin
ionocytes / mucous
pigment cells
Expression by stage/cluster
Correlated gene expression
Positive correlation
Negative correlation
Gene
r
Gene
r
aqp9a
0.277
srrt
-0.022
UST (1 of many)
0.230
prpf6
-0.022
RF00410
0.218
odc1
-0.022
si:ch211-248l17.3
0.214
rbm4.2
-0.021
ccl38.1
0.213
sfpq
-0.021
BX511024.1
0.191
srp72
-0.021
LOC108192083
0.191
sumo3b
-0.021
XLOC-029465
0.190
ppil1
-0.021
CU657925.1
0.188
wdr12
-0.020
CR361564.1
0.188
lyrm4
-0.020
CR759826.1
0.187
bhmt
-0.020
nts
0.183
prtfdc1
-0.020
LOC101884366
0.181
cnn3a
-0.020
LOC108190036
0.173
si:dkey-16l2.16
-0.020
LOC100004499
0.158
apoeb
-0.020
SHC3
0.158
rnf40
-0.019
tmem229a
0.157
vox
-0.019
LOC101884552
0.156
sash1a
-0.019
CU302316.1
0.151
rac1a
-0.019
CU179643.1
0.150
nono
-0.019
hsph1
0.145
apoc1
-0.019
fbxo41
0.140
ezh2
-0.018
grm2a
0.140
marcksb
-0.018
rca2.2
0.139
atad5a
-0.018
LOC108190082
0.136
smad5
-0.018
ccdc85a
0.135
tefa
-0.018
LOC559637
0.133
ube2l3a
-0.018
XLOC-000941
0.132
ccndbp1
-0.018
cunh18orf32
0.131
dnmt3bb.2
-0.018
pard6ga
0.128
kmt5ab
-0.018
si:dkey-30j10.5
0.125
sept15
-0.018
atp8b2
0.125
hspb1
-0.018
XLOC-005794
0.124
si:dkey-66i24.9
-0.018
si:dkey-23k10.2
0.124
cul3a
-0.018
BX511120.1
0.123
sp5l
-0.018