Daniocell
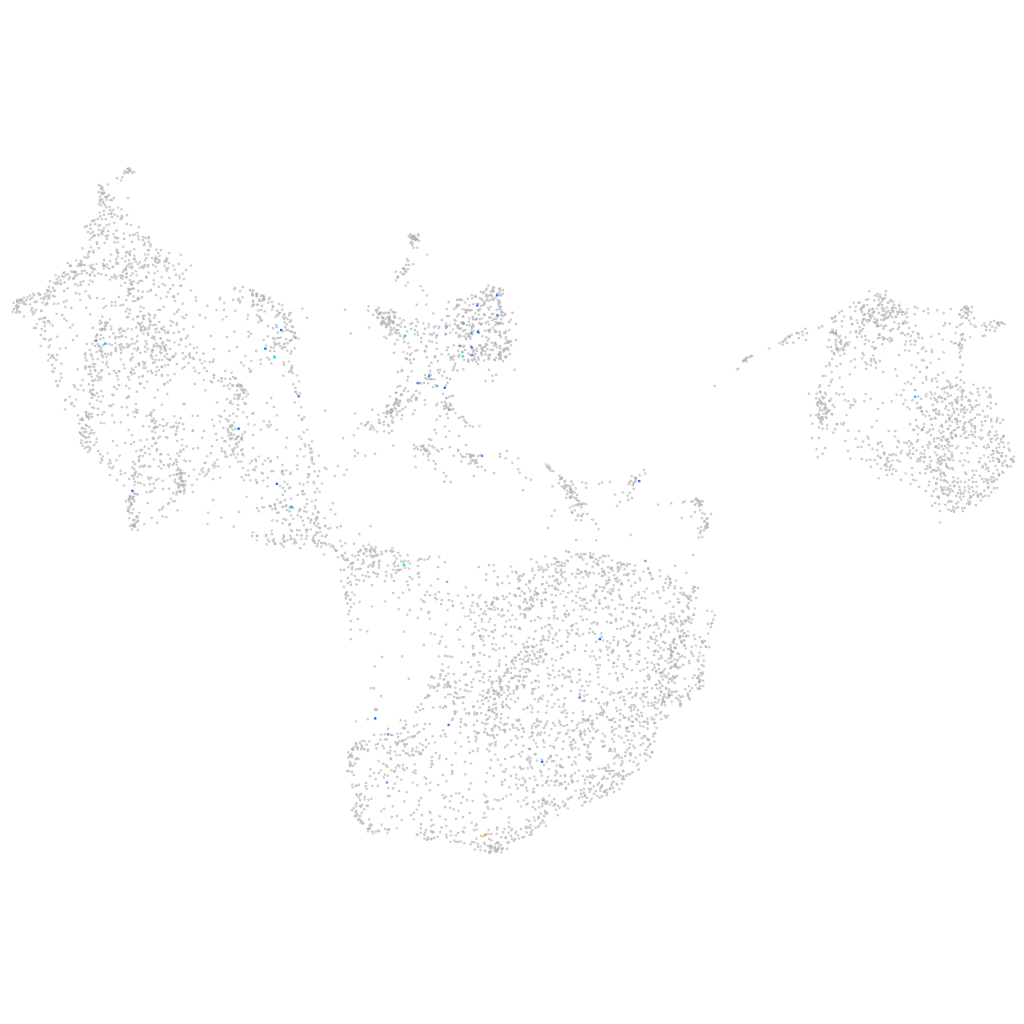
adarb1b (fin)
adenosine deaminase RNA specific B1b
ZFIN
Gene expression UMAP
Display:
Expression
Stage
Other cell groups
all cells
blastomeres
PGCs
endoderm
axial mesoderm
muscle
mural cells /
non-skeletal muscle
mesenchyme
hematopoietic /
vasculature
pronephros
neural
spinal cord / glia
eye
taste / olfactory
otic / lateral line
epidermis
periderm
fin
ionocytes / mucous
pigment cells
Expression by stage/cluster
Correlated gene expression
Positive correlation
Negative correlation
Gene
r
Gene
r
XLOC-014398
0.430
eef1a1l1
-0.061
si:ch73-261i21.5
0.396
si:dkey-151g10.6
-0.042
XLOC-044140
0.269
actb2
-0.041
XLOC-017492
0.259
rpl11
-0.041
tnni3k
0.256
lgals3b
-0.038
LOC110438433
0.251
rps24
-0.037
LOC101882378
0.251
rps3
-0.037
LOC108192080
0.245
pfn1
-0.037
LOC110439832
0.244
s100a10b
-0.037
XLOC-035162
0.241
rplp1
-0.037
XLOC-015089
0.230
cldn1
-0.036
LOC101883538
0.222
rpl19
-0.036
si:dkey-256e7.8
0.220
rplp0
-0.035
myo3a
0.216
tpt1
-0.035
si:ch211-120e1.7
0.216
anxa1a
-0.035
LOC108190755
0.215
rpl37
-0.034
si:ch211-205a14.3
0.214
epcam
-0.034
si:dkey-27l15.1
0.214
cyt1
-0.034
LO018680.1
0.208
rpl7a
-0.034
znf1050
0.202
myl12.1
-0.033
znf1158
0.196
rpl32
-0.033
sox8a
0.189
rps23
-0.032
XLOC-029423
0.187
rps26l
-0.032
CR762420.1
0.187
rpl28
-0.031
XLOC-020958
0.186
rps29
-0.031
BX640584.1
0.178
rps20
-0.031
CT737184.2
0.177
rpl26
-0.031
XLOC-014466
0.174
spaca4l
-0.030
LOC100536348
0.170
capza1b
-0.030
pcdh2g9
0.161
icn
-0.030
si:ch211-266k2.1
0.160
egr1
-0.030
erbb4a
0.160
txn
-0.030
etv1
0.159
tmem238a
-0.030
LOC101882959
0.156
ccng1
-0.030
rasgrf2a
0.154
si:dkey-33c14.3
-0.030