Daniocell
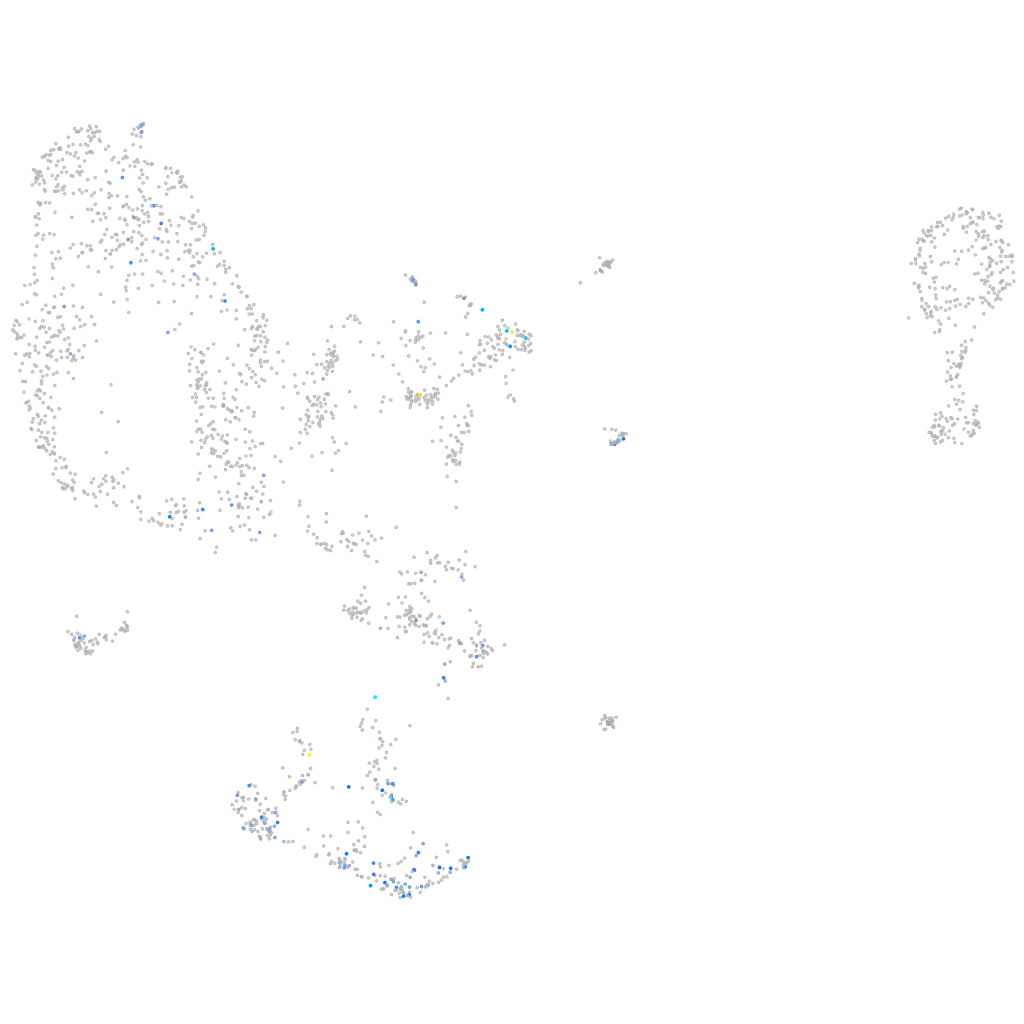
wu:fb05h10 (pronephros)
wu:fb05h10
ZFIN
Gene expression UMAP
Display:
Expression
Stage
Other cell groups
all cells
blastomeres
PGCs
endoderm
axial mesoderm
muscle
mural cells /
non-skeletal muscle
mesenchyme
hematopoietic /
vasculature
pronephros
neural
spinal cord / glia
eye
taste / olfactory
otic / lateral line
epidermis
periderm
fin
ionocytes / mucous
pigment cells
Expression by stage/cluster
Correlated gene expression
Positive correlation
Negative correlation
Gene
r
Gene
r
cyp17a1
0.354
rps12
-0.110
XLOC-034734
0.323
pabpc1a
-0.098
LOC110439623
0.312
eif5a2
-0.093
arf3a
0.304
rpsa
-0.092
XLOC-033024
0.293
rps2
-0.092
LOC108184022
0.293
si:dkey-194e6.1
-0.090
si:dkey-21e13.3
0.285
ptmab
-0.090
LOC108179692
0.283
rpl23a
-0.087
si:ch211-188c18.1
0.283
ran
-0.087
zgc:114120
0.283
wu:fb97g03
-0.085
si:ch1073-340i21.2
0.279
hspb1
-0.085
LOC110439526
0.274
hao1
-0.085
si:ch73-344o19.1
0.261
acy3.2
-0.083
TCERG1L
0.255
dab2
-0.082
BX005380.1
0.249
msna
-0.081
zgc:171482
0.248
grhprb
-0.081
il13
0.247
rpl18a
-0.079
kcnh1b
0.242
hoga1
-0.078
phlda2
0.231
pdzk1ip1
-0.077
piwil1
0.230
ppiaa
-0.076
nefma
0.227
apoc1
-0.075
XPO5
0.226
apoeb
-0.075
sncaip
0.225
si:rp71-17i16.6
-0.074
soul2
0.224
adka
-0.074
zgc:113886
0.221
slc9a3r1a
-0.074
cyp46a1.3
0.221
ddx18
-0.073
si:dkey-90m5.4
0.217
si:dkey-28n18.9
-0.073
esyt3
0.215
nop58
-0.073
tmem72
0.215
rps4x
-0.072
ccl19a.1
0.211
cubn
-0.072
adam23a
0.210
snrnp70
-0.071
rnf183
0.209
eif4bb
-0.071
mybpc1
0.208
zgc:101040
-0.071
smpd3
0.208
rps28
-0.071
nexmifa
0.206
lig1
-0.071