Daniocell
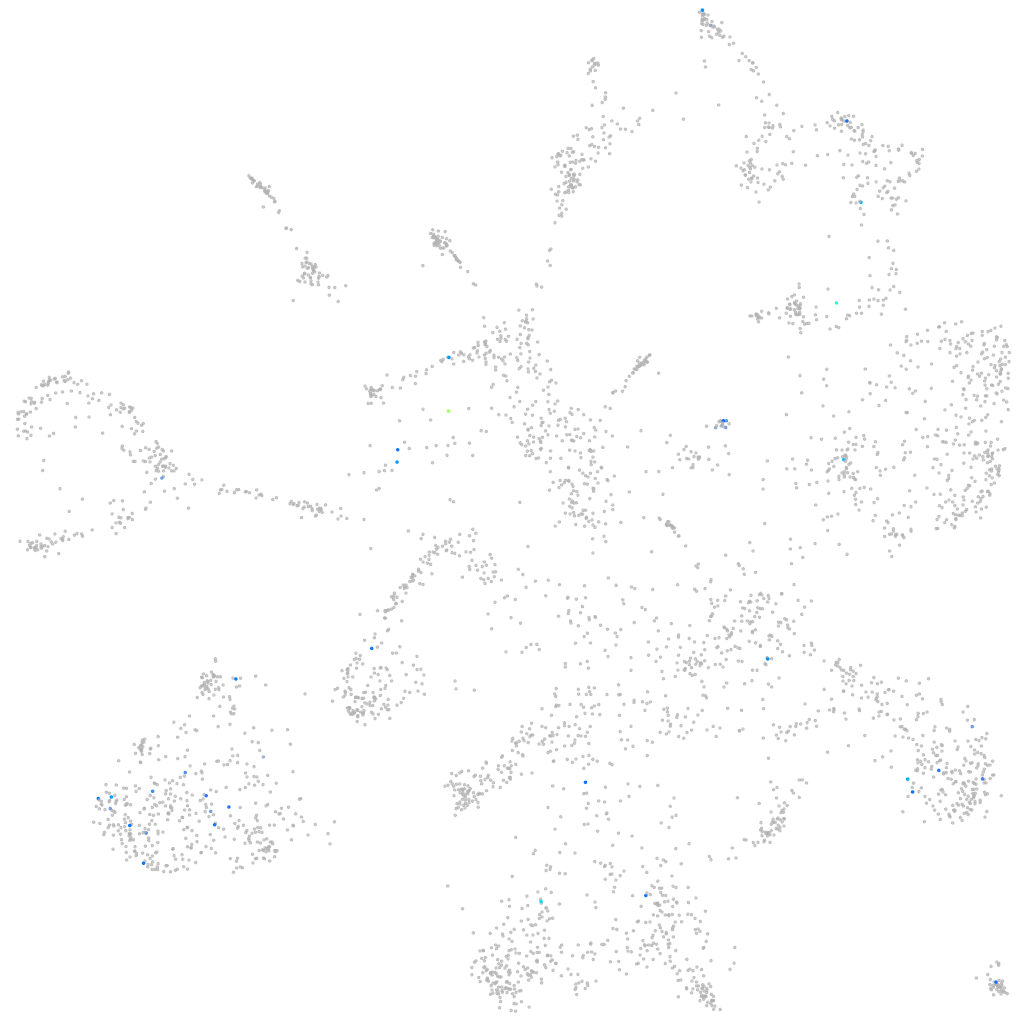
wu:fb05h10 (mural cells / non-skeletal muscle)
wu:fb05h10
ZFIN
Gene expression UMAP
Display:
Expression
Stage
Other cell groups
all cells
blastomeres
PGCs
endoderm
axial mesoderm
muscle
mural cells /
non-skeletal muscle
mesenchyme
hematopoietic /
vasculature
pronephros
neural
spinal cord / glia
eye
taste / olfactory
otic / lateral line
epidermis
periderm
fin
ionocytes / mucous
pigment cells
Expression by stage/cluster
Correlated gene expression
Positive correlation
Negative correlation
Gene
r
Gene
r
si:ch211-143l19.3
0.343
rpl23
-0.033
BX649324.1
0.323
ak1
-0.032
LOC100535396
0.323
meis1a
-0.031
LOC110438283
0.268
entpd1
-0.031
FP016106.1
0.260
hbbe1.2
-0.031
bsnd
0.257
cox4i2
-0.029
nrm
0.246
rps11
-0.029
LOC108181101
0.231
atp1b1a
-0.029
si:dkey-83f18.10
0.220
rcor1
-0.029
or111-2
0.217
vim
-0.029
CR513782.3
0.217
rpl39
-0.028
aspdh
0.200
prelid3b
-0.028
CABZ01096573.1
0.196
pvalb2
-0.028
LOC103910869
0.196
mgst3b
-0.028
si:dkey-121n8.7
0.191
pvalb1
-0.028
LOC108190371
0.183
fosb
-0.028
vav3a
0.182
mcl1a
-0.028
XLOC-008693
0.181
XLOC-002639
-0.028
si:ch1073-303d10.1
0.180
her9
-0.028
LOC100534805
0.176
slc25a5
-0.028
tmprss15
0.175
junba
-0.027
tmem237a
0.175
fhl3b
-0.027
acyp2
0.173
zeb2a
-0.027
LOC108179162
0.165
socs3a
-0.026
FP016005.1
0.165
nid2a
-0.026
si:dkey-103j14.5
0.158
her6
-0.026
unc80
0.153
loxa
-0.026
gdf5
0.152
ctrb1
-0.025
btr16.1
0.147
socs3b
-0.025
BX664742.2
0.147
zgc:110366
-0.025
AL954698.2
0.144
si:ch73-22o12.1
-0.025
XLOC-039672
0.143
s1pr3a
-0.025
XLOC-030238
0.142
snai1a
-0.025
LOC110437835
0.142
exoc7
-0.025
LOC101882460.1
0.140
tgfb2
-0.025