Daniocell
wu:fb05h10 (pigment cells)
wu:fb05h10
ZFIN
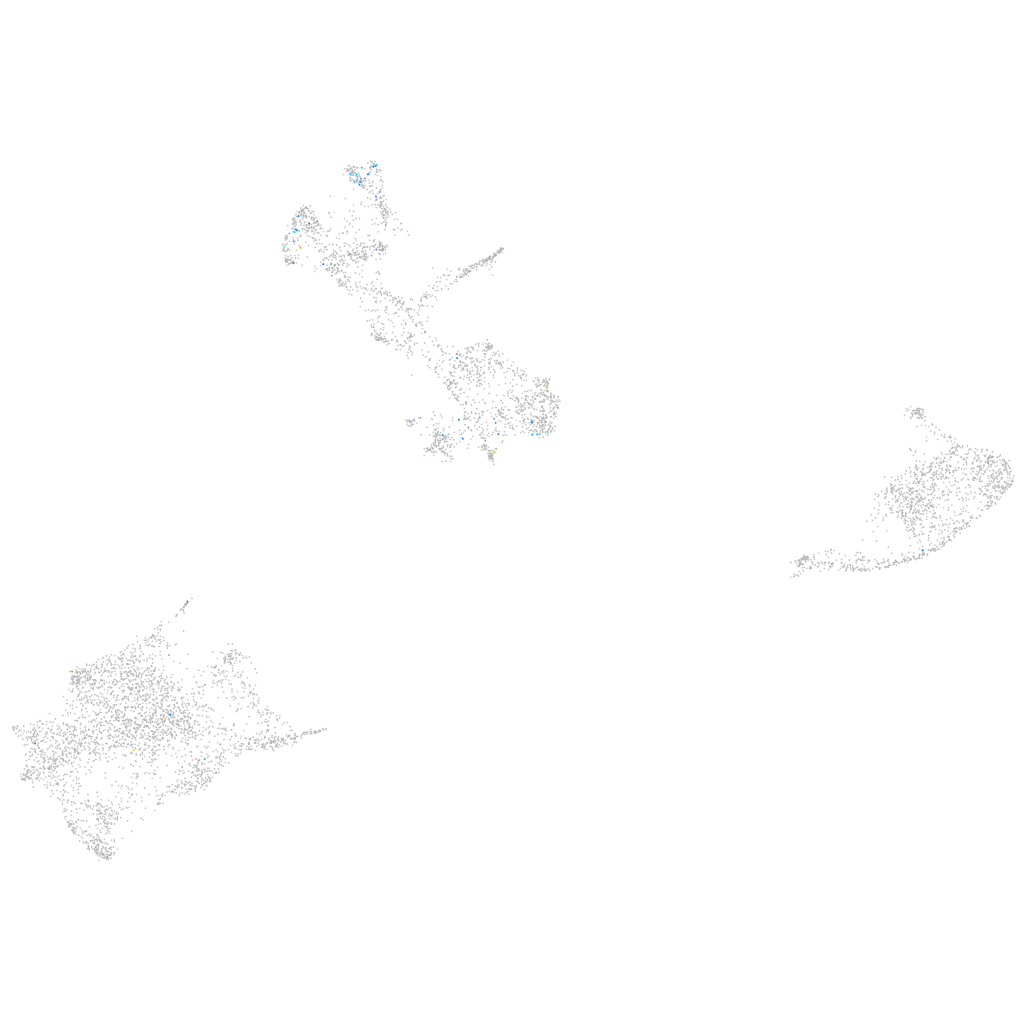
Gene expression UMAP
Display:
Expression
Stage
Other cell groups
all cells
blastomeres
PGCs
endoderm
axial mesoderm
muscle
mural cells /
non-skeletal muscle
mesenchyme
hematopoietic /
vasculature
pronephros
neural
spinal cord / glia
eye
taste / olfactory
otic / lateral line
epidermis
periderm
fin
ionocytes / mucous
pigment cells
Expression by stage/cluster
Correlated gene expression
Positive correlation
Negative correlation
Gene
r
Gene
r
LOC101882521
0.300
fabp3
-0.057
grem1a
0.226
gch2
-0.050
and4
0.225
pts
-0.048
XLOC-034776
0.225
akr1b1
-0.047
BX649337.2
0.195
pcbd1
-0.047
mical1
0.190
tfap2e
-0.038
si:ch211-252f13.5
0.190
mitfa
-0.037
taf4b
0.189
marcksl1b
-0.036
tapbpl
0.174
slc2a11b
-0.036
caprin2
0.170
C12orf75
-0.036
grxcr1a.1
0.170
aox5
-0.035
XLOC-013854
0.165
aqp3a
-0.035
guca1e
0.162
mlpha
-0.034
cyp2ad2
0.160
tspan10
-0.034
LO018508.1
0.154
gpd1b
-0.034
si:ch211-202f3.3
0.152
tmem243a
-0.034
adamts3
0.148
pfn2
-0.033
si:dkey-21o22.2
0.147
si:dkey-56m19.5
-0.033
si:ch211-37e10.2
0.147
slc22a7a
-0.033
XLOC-016511
0.146
gstt1a
-0.033
CR848736.1
0.145
cax1
-0.032
pop1
0.143
si:ch211-194k22.8
-0.032
BX927362.2
0.139
sprb
-0.032
BX927329.2
0.139
CABZ01021592.1
-0.032
LOC101885149
0.138
dct
-0.032
si:dkey-21e13.3
0.137
zeb2a
-0.032
sstr5
0.135
rps14
-0.031
znf1053
0.135
si:dkey-251i10.2
-0.030
lrrn3a
0.135
phlda1
-0.030
dnm1b
0.135
cdo1
-0.030
LOC101886923
0.133
rab34b
-0.030
colgalt2
0.133
gyg1b
-0.030
usp53b
0.129
pmela
-0.030
pclob
0.127
actb2
-0.029
CABZ01074130.1
0.125
ap3m2
-0.029