Daniocell
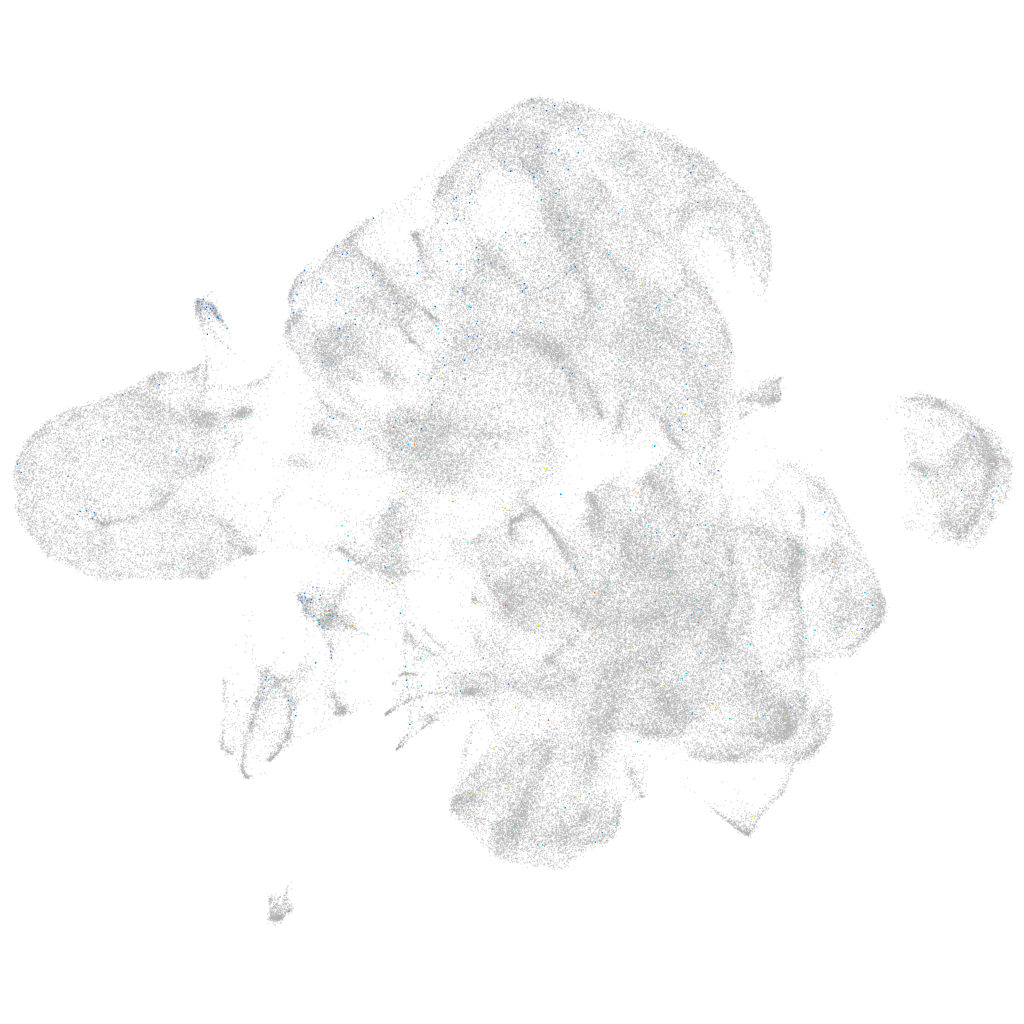
tnfrsf1b (neural)
"tumor necrosis factor receptor superfamily, member 1B"
ZFIN
Gene expression UMAP
Display:
Expression
Stage
Other cell groups
all cells
blastomeres
PGCs
endoderm
axial mesoderm
muscle
mural cells /
non-skeletal muscle
mesenchyme
hematopoietic /
vasculature
pronephros
neural
spinal cord / glia
eye
taste / olfactory
otic / lateral line
epidermis
periderm
fin
ionocytes / mucous
pigment cells
Expression by stage/cluster
Correlated gene expression
Positive correlation
Negative correlation
Gene
r
Gene
r
clic6
0.104
ptmab
-0.024
BX324153.1
0.074
h3f3d
-0.022
LOC100535518
0.061
hmgn6
-0.020
si:ch211-284k5.2
0.059
tubb2b
-0.019
erbb3b
0.052
hnrnpaba
-0.019
LOC101885828
0.052
si:ch73-1a9.3
-0.017
si:ch73-233m11.2
0.052
si:ch211-222l21.1
-0.016
XLOC-005605
0.050
si:dkey-56m19.5
-0.016
CR339041.1
0.049
calm2b
-0.015
CT033796.1
0.048
hmgb1b
-0.014
FP067442.1
0.047
hnrnpa0b
-0.014
XLOC-006508
0.046
hnrnpabb
-0.014
CABZ01038493.1
0.046
hmgb3a
-0.014
edar
0.045
sumo3a
-0.014
lamb1b
0.045
si:ch211-288g17.3
-0.013
sox10
0.045
si:dkey-276j7.1
-0.013
si:dkey-76p14.2
0.044
ubc
-0.013
LOC110438211
0.044
zc4h2
-0.013
limd1a
0.043
hmgb1a
-0.013
cyp8b2
0.043
cirbpb
-0.012
FO704745.1
0.041
fez1
-0.012
col4a1
0.040
hnrnpl
-0.012
clec3ba
0.040
h2afvb
-0.012
BX119992.1
0.040
erh
-0.012
pmp22a
0.037
nucks1a
-0.012
slc26a2
0.036
elavl3
-0.012
obscna
0.035
hnrnpd
-0.012
reck
0.035
marcksb
-0.012
col4a2
0.035
tuba1c
-0.011
CR383662.4
0.035
hnrnpub
-0.011
scn4ab
0.035
gng3
-0.011
ednrab
0.035
srsf4
-0.011
mcamb
0.035
khdrbs1a
-0.011
c7b
0.034
hp1bp3
-0.011
LOC101884019
0.034
zmat2
-0.011