Daniocell
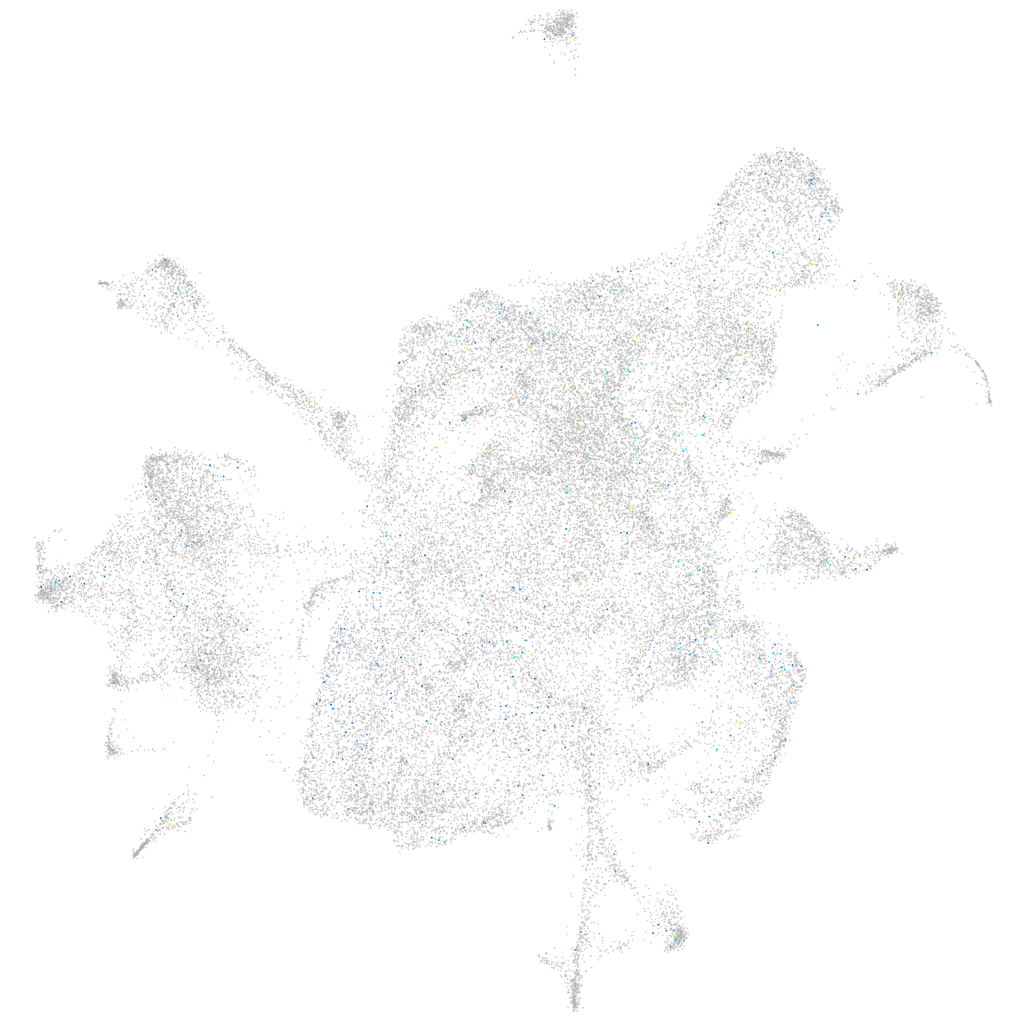
tnfrsf1b (mesenchyme)
"tumor necrosis factor receptor superfamily, member 1B"
ZFIN
Gene expression UMAP
Display:
Expression
Stage
Other cell groups
all cells
blastomeres
PGCs
endoderm
axial mesoderm
muscle
mural cells /
non-skeletal muscle
mesenchyme
hematopoietic /
vasculature
pronephros
neural
spinal cord / glia
eye
taste / olfactory
otic / lateral line
epidermis
periderm
fin
ionocytes / mucous
pigment cells
Expression by stage/cluster
Correlated gene expression
Positive correlation
Negative correlation
Gene
r
Gene
r
LOC110437999
0.107
hmgn6
-0.019
LOC101882326
0.093
ptmab
-0.016
NPC2 (1 of many)
0.081
zgc:193541
-0.016
si:ch73-267c23.10
0.081
hmgn2
-0.016
XLOC-011709
0.078
lsm6
-0.016
LOC108191949
0.074
si:ch73-1a9.3
-0.015
XLOC-000339
0.073
hmgb1a
-0.015
FP016247.1
0.071
rps12
-0.014
si:ch73-343l4.2
0.070
rps20
-0.014
chrm5b
0.068
lsm7
-0.014
CR812470.2
0.067
hmgb2b
-0.014
si:busm1-266f07.2
0.065
tmsb
-0.014
htr2aa
0.065
si:ch73-281n10.2
-0.014
FP102171.1
0.064
si:ch1073-325m22.2
-0.014
psmb8a
0.062
rplp2l
-0.014
smim1
0.059
atp5pd
-0.014
olfcg4
0.059
zc4h2
-0.014
CT027676.1
0.058
suclg1
-0.014
fcer1g
0.056
si:ch73-46j18.5
-0.013
CU856423.1
0.054
CU467822.1
-0.013
si:dkey-11o1.6
0.053
myl10
-0.013
BX004816.2
0.052
cript
-0.013
XLOC-026497
0.052
id3
-0.013
CU207301.2
0.050
rbm8a
-0.013
tekt2
0.049
arpc3
-0.013
CT583650.1
0.049
tp53inp2
-0.013
p2ry10
0.048
fryb
-0.012
retsatl
0.048
atp5f1e
-0.012
kcnk13b
0.047
cct5
-0.012
cxcr3.2
0.047
arid2
-0.012
LOC103910804
0.045
ctnnd1
-0.012
FO818743.1
0.043
si:ch211-194k22.8
-0.012
BX276107.1
0.043
ndufs3
-0.012
LOC108180147
0.042
sdf2l1
-0.012
il17a/f2
0.042
lmx1bb
-0.012