Daniocell
tbx2b (blastomeres)
T-box transcription factor 2b
ZFIN
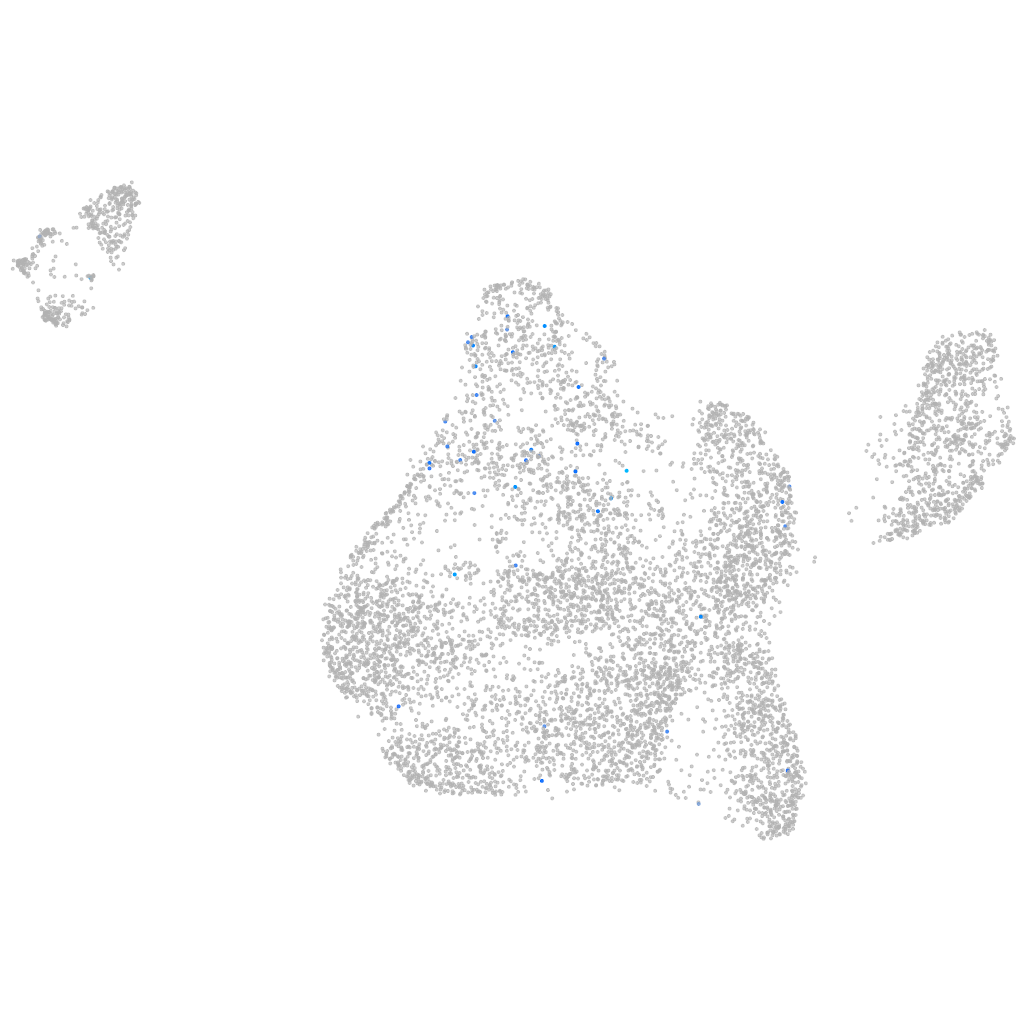
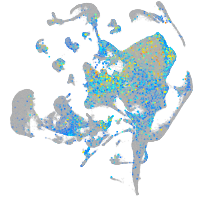
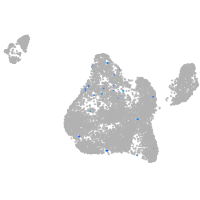
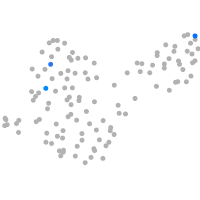
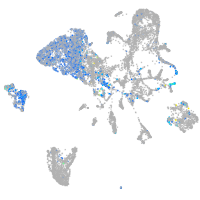
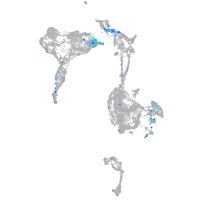
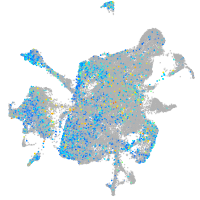
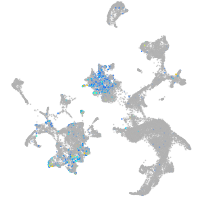
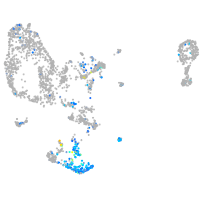
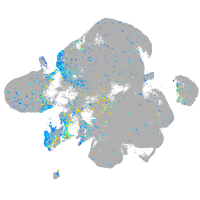
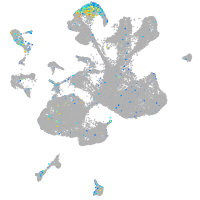
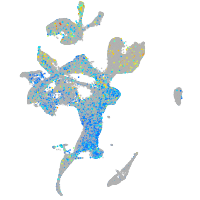
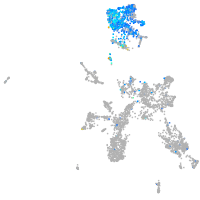
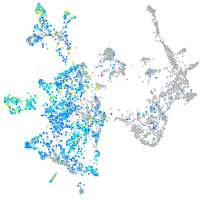
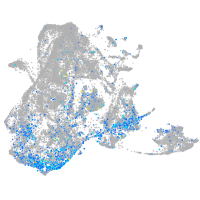
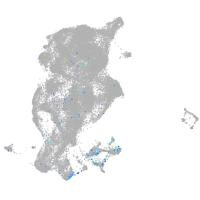
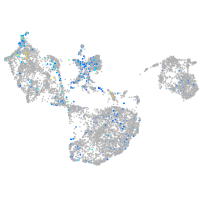
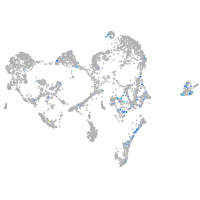
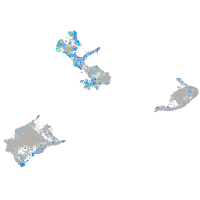
Gene expression UMAP
Display:
Expression
Stage
Other cell groups
all cells
blastomeres
PGCs
endoderm
axial mesoderm
muscle
mural cells /
non-skeletal muscle
mesenchyme
hematopoietic /
vasculature
pronephros
neural
spinal cord / glia
eye
taste / olfactory
otic / lateral line
epidermis
periderm
fin
ionocytes / mucous
pigment cells
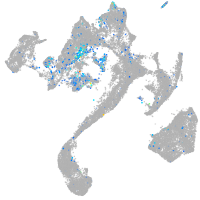
Expression by stage/cluster
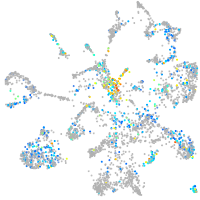
Correlated gene expression
Positive correlation
Negative correlation
Gene
r
Gene
r
bmp3
0.209
cited4b
-0.066
LOC108191314
0.193
sox3
-0.057
LOC103910453
0.188
sox19a
-0.055
si:dkey-79f11.8
0.156
shisa2a
-0.049
LOC100003040
0.153
glulb
-0.046
BX072576.1
0.147
asb11
-0.043
LOC101884506
0.145
zic2b
-0.043
pcdh2ab2
0.145
inka1a
-0.041
LOC108183387
0.136
cxcr4a
-0.039
LOC101886933
0.134
si:ch211-173m16.2
-0.037
LOC100332639
0.133
zgc:100951
-0.034
dapp1
0.133
mycla
-0.034
myct1a
0.133
foxd5
-0.032
alox5b.2
0.132
hint1
-0.032
CR388079.2
0.125
cldnd
-0.032
LOC110438339
0.122
lfng
-0.031
CU929402.1
0.120
slu7
-0.031
wnt8b
0.120
zgc:111868
-0.030
XLOC-011522
0.119
cxcr4b
-0.030
si:dkey-121j17.5
0.118
blf
-0.029
scpp1
0.117
tubb4b
-0.029
XLOC-001974
0.115
gpd1b
-0.029
slc17a7a
0.115
selenot1a
-0.028
CABZ01046407.1
0.115
atad2b
-0.028
XLOC-043741
0.114
ccna2
-0.028
CR457444.5
0.113
trappc6b
-0.028
nptxra
0.111
si:ch211-170d8.2
-0.027
slc22a6l
0.111
cox17
-0.027
XLOC-034498
0.111
ckbb
-0.027
shank3b
0.110
ddx3xb
-0.027
micall1b.2
0.108
kazald2
-0.027
tbx16l
0.107
sh3glb1a
-0.027
si:ch211-247i17.1
0.106
rnf185
-0.026
nox5
0.104
mex3b
-0.026
XLOC-019150
0.104
ptpn2b
-0.026